IBM 2012 Annual Report Download - page 56
Download and view the complete annual report
Please find page 56 of the 2012 IBM annual report below. You can navigate through the pages in the report by either clicking on the pages listed below, or by using the keyword search tool below to find specific information within the annual report.-
 1
1 -
2
-
3
-
4
-
5
-
6
-
7
-
8
-
9
-
10
-
11
-
12
-
13
-
14
-
15
-
16
-
17
-
18
-
19
-
20
-
21
-
22
-
23
-
24
-
25
-
26
-
27
-
28
-
29
-
30
-
31
-
32
-
33
-
34
-
35
-
36
-
37
-
38
-
39
-
40
-
41
-
42
-
43
-
44
-
45
-
 46
46 -
 47
47 -
 48
48 -
 49
49 -
 50
50 -
 51
51 -
 52
52 -
 53
53 -
 54
54 -
 55
55 -
 56
56 -
 57
57 -
 58
58 -
 59
59 -
 60
60 -
 61
61 -
 62
62 -
 63
63 -
 64
64 -
 65
65 -
 66
66 -
67
-
68
-
69
-
70
-
71
-
72
-
73
-
74
-
75
-
76
-
77
-
78
-
79
-
80
-
81
-
82
-
83
-
84
-
85
-
86
-
87
-
88
-
89
-
90
-
91
-
92
-
93
-
94
-
95
-
96
-
97
-
98
-
99
-
100
-
101
-
102
-
103
-
104
-
105
-
106
-
107
-
108
-
109
-
110
-
111
-
112
-
113
-
114
-
115
-
116
-
117
-
118
-
119
-
120
-
121
-
122
-
123
-
124
-
125
-
126
-
127
-
128
-
129
-
130
-
131
-
132
-
133
-
134
-
135
-
136
-
137
-
138
-
139
-
140
-
141
-
142
-
143
-
144
-
145
-
146
 |
 |

55
Management Discussion
International Business Machines Corporation and Subsidiary Companies
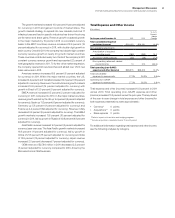
Other Information
Looking Forward
In 2012, the company delivered revenue of $104.5 billion, net income
of $16.6 billion, up 4.7 percent and earnings per share of $14.37, an
increase of 10.0 percent compared to 2011. Operating (non-GAAP)
earnings per share was $15.25, an increase of 13.5 percent versus
the prior year. The 2012 results put the company well on track to its
2015 operating earnings per share road map objective.
The company measures the success of its business model over
the long term, not any individual quarter or year. The company’s
strategies, investments and actions are all taken with an objective
of optimizing long-term performance.
In May 2010, the company met with investors and introduced
a road map for earnings per share in 2015. The objective of the
road map for growth is to achieve at least $20 of operating (non-
GAAP) earnings per diluted share in 2015. The company has
identified the major drivers of financial performance: revenue
growth, margin expansion and common stock share repurchase.
The revenue growth will come from a combination of base revenue
growth, a shift to faster growing businesses and from acquisitions
closed between 2010 and 2015. The contribution from margin
expansion will be driven by the mix of higher margin businesses
and enterprise productivity. The company will also continue to
return value to its shareholders, with approximately $50 billion of
gross share repurchases and $20 billion of dividends expected
during the road map period.
Looking forward, the company expects to continue its trans-
formation in 2013. The company will continue to acquire key
capabilities, divest of certain businesses, rebalance its workforce
and invest in innovation. The company continues to retool its skills
and offerings to shift to higher value content and meet its clients’
needs. The company’s expectation for 2013 includes all these fac-
tors. In January 2013, the company disclosed that it is expecting
GAAP earnings of at least $15.53 and operating (non-GAAP) earn-
ings of at least $16.70 per diluted share for the full year 2013. The
operating (non-GAAP) earnings per share expectation excludes
acquisition-related charges of $0.48 per share and non-operating
retirement-related costs of $0.69 per share. This expectation results
in an increase year to year of 8 percent in GAAP earnings per share
and an increase of 10 percent year to year in operating (non-GAAP)
earnings per share which keeps the company on track to its 2015
objective. On an operating (non-GAAP) basis, the company expects
the first half earnings per share growth rate to be slightly higher
than the growth rate in the second half primarily driven by the new
System z mainframe content and the resulting year-to-year product
cycle impacts.
From a segment perspective, the Software business once again
delivered strong results in 2012 and continued market leadership.
The company expects the Software business to continue its momen-
tum in 2013 and deliver revenue growth in the mid single-digits on a
constant currency basis with strong profit contribution. Within Global
Services, entering 2013, the company will continue to drive its key
plays and shift toward higher value content. The company will
continue to invest in the growth markets—which represent over 20
percent of services revenue and where the company sees the most
opportunity for growth. The company will continue to transform the
services portfolio to higher value content, and away from the more
commoditizing labor-based content. Global Services profit and
margin performance will continue to benefit from the work being
done to infuse more IP content into its offerings. In addition, Global
Services will continue to be the prime beneficiary of the focus on
enterprise productivity. The company believes that Global Services
has a good set of opportunities to continue to drive profit growth and
margin expansion in 2013. As a result, the company expects the
Global Services business to deliver profit growth in 2013, consistent
with its business model expectations, with double-digit profit growth
in the first quarter. In addition, with its backlog growth and the mix
toward longer duration engagements, the company expects Global
Business Services to return to revenue growth at constant currency
in 2013. Within Systems and Technology, looking forward to 2013,
performance in the first half of the year will be defined by the momen-
tum related to the System z mainframe content. The company
expects that momentum to drive double-digit profit growth in Sys-
tems and Technology in the first half of 2013.
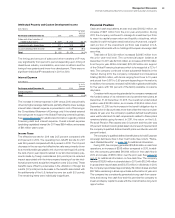
The economy could impact the credit quality of the company’s
receivables, and therefore the allowance for credit losses. The com-
pany will continue to apply its rigorous credit policies and analysis,
and will also continue to monitor the current economic environment,
particularly in Europe. Total receivables in Portugal, Italy, Ireland,
Greece and Spain were approximately $2.7 billion and $2.6 billion, net
of allowances, and represented approximately 7 percent of total net
trade and financing accounts receivables at December 31, 2012 and
2011, respectively. The company will continue to monitor potential
exposures in these countries in conjunction with the application of its
credit policies.
The company expects 2013 pre-tax retirement-related plan
cost to be approximately $3.1 billion, an increase of approximately
$700 million compared to 2012. This estimate reflects current
pension plan assumptions at December 31, 2012. Within total
retirement-related plan cost, operating retirement-related plan cost
is expected to be approximately $1.9 billion, an increase of approxi-
mately $100 million versus 2012. Non-operating retirement-related
plan cost is expected to be approximately $1.1 billion, an increase
of approximately $600 million, compared to 2012. See note S,
“Retirement-Related Benefits,” on pages 120 to 134 for additional
information.
The company expects in the normal course of business that
its effective tax rate and operating (non-GAAP) tax rate will be
approximately 25 percent in 2013. The rate will change year to year
based on non-recurring events, such as the settlement of income
tax audits and changes in tax laws, as well as recurring factors
including the geographic mix of income before taxes, the timing
and amount of foreign dividend repatriation, state and local taxes
and the effects of various global income tax strategies.