IBM 2012 Annual Report Download - page 130
Download and view the complete annual report
Please find page 130 of the 2012 IBM annual report below. You can navigate through the pages in the report by either clicking on the pages listed below, or by using the keyword search tool below to find specific information within the annual report.-
 1
1 -
2
-
3
-
4
-
5
-
6
-
7
-
8
-
9
-
10
-
11
-
12
-
13
-
14
-
15
-
16
-
17
-
18
-
19
-
20
-
21
-
22
-
23
-
24
-
25
-
26
-
27
-
28
-
29
-
30
-
31
-
32
-
33
-
34
-
35
-
36
-
37
-
38
-
39
-
40
-
41
-
42
-
43
-
44
-
45
-
46
-
47
-
48
-
49
-
50
-
51
-
52
-
53
-
54
-
55
-
56
-
57
-
58
-
59
-
60
-
61
-
62
-
63
-
64
-
65
-
66
-
67
-
68
-
69
-
70
-
71
-
72
-
73
-
74
-
75
-
76
-
77
-
78
-
79
-
80
-
81
-
82
-
83
-
84
-
85
-
86
-
87
-
88
-
89
-
90
-
91
-
92
-
93
-
94
-
95
-
96
-
97
-
98
-
99
-
100
-
101
-
102
-
103
-
104
-
105
-
106
-
107
-
108
-
109
-
110
-
111
-
112
-
113
-
114
-
115
-
116
-
117
-
118
-
119
-
 120
120 -
 121
121 -
 122
122 -
 123
123 -
 124
124 -
 125
125 -
 126
126 -
 127
127 -
 128
128 -
 129
129 -
 130
130 -
 131
131 -
 132
132 -
 133
133 -
 134
134 -
 135
135 -
 136
136 -
 137
137 -
 138
138 -
 139
139 -
 140
140 -
141
-
142
-
143
-
144
-
145
-
146
 |
 |

Notes to Consolidated Financial Statements
International Business Machines Corporation and Subsidiary Companies
129
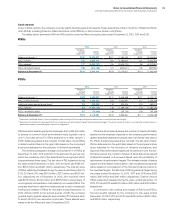
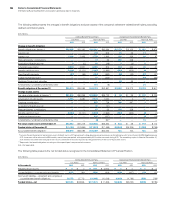
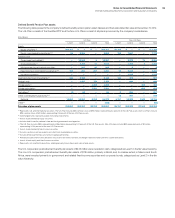
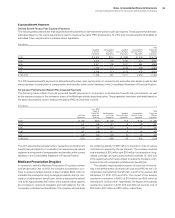
Defined Benefit Pension Plan assets
The following table presents the company’s defined benefit pension plans’ asset classes and their associated fair value at December 31, 2012.
The U.S. Plan consists of the Qualified PPP and the Non-U.S. Plans consist of all plans sponsored by the company’s subsidiaries.
($ in millions)
U.S. Plan Non-U.S. Plans
Level 1 Level 2 Level 3 To t a l Level 1 Level 2 Level 3 To t a l
Equity
Equity securities (a) $15,161 $ 1 $ — $15,163 $6,395 $ — $ — $ 6,395
Equity commingled/mutual funds (b)(c) 96 2,556 — 2,652 138 7,641 — 7,779
Fixed income
Government and related (d) — 12,945 6 12,951 — 8,978 76 9,054
Corporate bonds (e) — 8,499 11 8,510 — 1,878 5 1,883
Mortgage and asset-backed securities — 922 45 968 — 9 — 9
Fixed income commingled/mutual funds (b)(f) 155 804 267 1,226 78 8,018 — 8,096
Insurance contracts — — — — — 1,019 — 1,019
Cash and short-term investments (g) 244 3,198 — 3,442 134 373 — 507
Hedge funds — 1,402 756 2,159 — 646 — 646
Private equity (h) — — 4,085 4,085 — — 353 353
Private real estate (h) — — 2,861 2,861 — — 609 609
Derivatives (i) (6) 62 — 56 0 856 — 857
Other commingled/mutual funds (b)(j) — — — — 12 907 — 919
Subtotal 15,650 30,390 8,032 54,072 6,757 30,325 1,042 38,124
Other (k) — — — (442) — — — (66)
Fair value of plan assets $15,650 $30,390 $8,032 $53,630 $6,757 $30,325 $1,042 $38,058
(a) Represents U.S. and international securities. The U.S. Plan includes IBM common stock of $113 million, representing 0.2 percent of the U.S. Plan assets. Non-U.S. Plans include
IBM common stock of $40 million, representing 0.1 percent of the non-U.S. Plans assets.
(b) Commingled funds represent pooled institutional investments.
(c) Invests in predominantly equity securities.
(d) Includes debt issued by national, state and local governments and agencies.
(e) The U.S. Plan includes IBM corporate bonds of $6 million, representing 0.01 percent of the U.S. Plan assets. Non-U.S. plans include IBM corporate bonds of $2 million
representing 0.004 percent of the non-U.S. Plan assets.
(f) Invests in predominantly fixed income securities.
(g) Includes cash and cash equivalents and short-term marketable securities.
(h) Includes limited partnerships and venture capital partnerships.
(i) Primarily includes interest rate derivatives and, to a lesser extent, forwards, exchange traded and other over-the-counter derivatives.
(j) Invests in both equity and fixed income securities.
(k) Represents net unsettled transactions, relating primarily to purchases and sales of plan assets.
The U.S. nonpension postretirement benefit plan assets of $433 million were invested in cash, categorized as Level 1 in the fair value hierarchy.
The non-U.S. nonpension postretirement benefit plan assets of $119 million, primarily in Brazil, and, to a lesser extent, in Mexico and South
Africa, were invested primarily in government and related fixed income securities and corporate bonds, categorized as Level 2 in the fair
value hierarchy.