IBM 2012 Annual Report Download - page 11
Download and view the complete annual report
Please find page 11 of the 2012 IBM annual report below. You can navigate through the pages in the report by either clicking on the pages listed below, or by using the keyword search tool below to find specific information within the annual report.-
 1
1 -
 2
2 -
 3
3 -
 4
4 -
 5
5 -
 6
6 -
 7
7 -
 8
8 -
 9
9 -
 10
10 -
 11
11 -
 12
12 -
 13
13 -
 14
14 -
 15
15 -
 16
16 -
 17
17 -
 18
18 -
 19
19 -
 20
20 -
 21
21 -
 22
22 -
23
-
24
-
25
-
26
-
27
-
28
-
29
-
30
-
31
-
32
-
33
-
34
-
35
-
36
-
37
-
38
-
39
-
40
-
41
-
42
-
43
-
44
-
45
-
46
-
47
-
48
-
49
-
50
-
51
-
52
-
53
-
54
-
55
-
56
-
57
-
58
-
59
-
60
-
61
-
62
-
63
-
64
-
65
-
66
-
67
-
68
-
69
-
70
-
71
-
72
-
73
-
74
-
75
-
76
-
77
-
78
-
79
-
80
-
81
-
82
-
83
-
84
-
85
-
86
-
87
-
88
-
89
-
90
-
91
-
92
-
93
-
94
-
95
-
96
-
97
-
98
-
99
-
100
-
101
-
102
-
103
-
104
-
105
-
106
-
107
-
108
-
109
-
110
-
111
-
112
-
113
-
114
-
115
-
116
-
117
-
118
-
119
-
120
-
121
-
122
-
123
-
124
-
125
-
126
-
127
-
128
-
129
-
130
-
131
-
132
-
133
-
134
-
135
-
136
-
137
-
138
-
139
-
140
-
141
-
142
-
143
-
144
-
145
-
146
 |
 |

10
4
8
$20
16
12
0
00 12
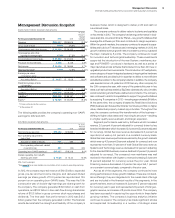
18.2
6.7
10.1%
22.2%
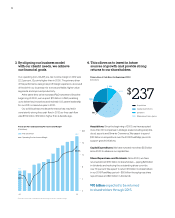
Our operating (non-GAAP) pre-tax income margin in 2012 was
22.2 percent, 12 points higher than in 2000. The primary driver
of this performance was gross profit margin expansion, as a result
of the shift in our business mix to more profitable, higher-value
segments and improved productivity.
At the same time, we’ve increased R&D investment. Since the
beginning of 2000, we’ve spent $75 billion in R&D, enabling
us to deliver key innovations and maintain U.S. patent leadership
for our 20th consecutive year in 2012.
Our solid business model performance has resulted in
consistently strong free cash flow. In 2012 our free cash flow
was $18.2 billion, $12 billion higher than a decade ago.
3. By aligning our business model
with our clients’ needs, we achieve
our financial goals.
4. This allows us to invest in future
sources of growth and provide strong
returns to our shareholders.
Primary Uses of Cash Since the Beginning of 2000
($ in billions)
Free Cash Flow and Operating Pre-tax Income Margin*
($ in billions)
Free Cash Flow
Operating Pre-tax Income Margin
$237
Acquisitions
Dividends
Capital expenditures
Share repurchases (gross)
Acquisitions: Since the beginning of 2000, we have acquired
more than 140 companies in strategic areas including analytics,
cloud, security and Smarter Commerce. We expect to spend
$20 billion in acquisitions over the 2015 Road Map period to
support growth initiatives.
Capital Expenditures: We have invested more than $55 billion
since 2000 to advance our capabilities.
Share Repurchase and Dividends: Since 2000, we have
returned almost $150 billion to shareholders—paying $26 billion
in dividends and reducing the outstanding share count by
over 35 percent. We expect to return $70 billion to shareholders
in our 2015 Road Map period—$50 billion through gross share
repurchases and $20 billion in dividends.
$123
$26
$55
$33
* Excludes acquisition-related and nonoperating retirement-related charges.
$
70 billion expected to be returned
to shareholders through 2015.