IBM 2012 Annual Report Download - page 67
Download and view the complete annual report
Please find page 67 of the 2012 IBM annual report below. You can navigate through the pages in the report by either clicking on the pages listed below, or by using the keyword search tool below to find specific information within the annual report.-
 1
1 -
2
-
3
-
4
-
5
-
6
-
7
-
8
-
9
-
10
-
11
-
12
-
13
-
14
-
15
-
16
-
17
-
18
-
19
-
20
-
21
-
22
-
23
-
24
-
25
-
26
-
27
-
28
-
29
-
30
-
31
-
32
-
33
-
34
-
35
-
36
-
37
-
38
-
39
-
40
-
41
-
42
-
43
-
44
-
45
-
46
-
47
-
48
-
49
-
50
-
51
-
52
-
53
-
54
-
55
-
56
-
 57
57 -
 58
58 -
 59
59 -
 60
60 -
 61
61 -
 62
62 -
 63
63 -
 64
64 -
 65
65 -
 66
66 -
 67
67 -
 68
68 -
 69
69 -
 70
70 -
 71
71 -
 72
72 -
 73
73 -
 74
74 -
 75
75 -
 76
76 -
 77
77 -
78
-
79
-
80
-
81
-
82
-
83
-
84
-
85
-
86
-
87
-
88
-
89
-
90
-
91
-
92
-
93
-
94
-
95
-
96
-
97
-
98
-
99
-
100
-
101
-
102
-
103
-
104
-
105
-
106
-
107
-
108
-
109
-
110
-
111
-
112
-
113
-
114
-
115
-
116
-
117
-
118
-
119
-
120
-
121
-
122
-
123
-
124
-
125
-
126
-
127
-
128
-
129
-
130
-
131
-
132
-
133
-
134
-
135
-
136
-
137
-
138
-
139
-
140
-
141
-
142
-
143
-
144
-
145
-
146
 |
 |

6666 Management Discussion
International Business Machines Corporation and Subsidiary Companies
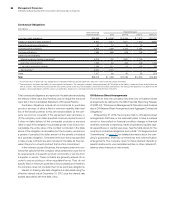
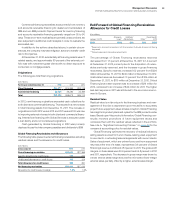
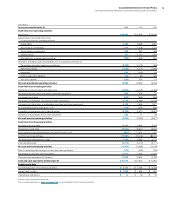
The table below presents the recorded amount of unguaranteed
residual value for sales-type, direct financing and operating leases
at December 31, 2011 and 2012. In addition, the table presents the
residual value as a percentage of the related original amount
financed and a run out of when the unguaranteed residual value
assigned to equipment on leases at December 31, 2012 is expected
to be returned to the company. In addition to the unguaranteed
residual value, on a limited basis, Global Financing will obtain guar-
antees of the future value of the equipment to be returned at end of
lease. While primarily focused on IBM products, guarantees are also
obtained for certain OEM products. These third-party guarantees
are included in minimum lease payments as provided for by
accounting standards in the determination of lease classifications
for the covered equipment and provide protection against risk of
loss arising from declines in equipment values for these assets.
The residual value guarantee increases the minimum lease
payments that are utilized in determining the classification of a
lease as a sales-type lease, a direct financing lease or an operating
lease. The aggregate asset values associated with the guarantees
for sales-type leases were $776 million and $821 million for the
financing transactions originated during the years ended December
31, 2012 and 2011, respectively. In 2012, the residual value guarantee
program resulted in the company recognizing approximately $601
million of revenue that would otherwise have been recognized in
future periods as operating lease revenue. If the company had
chosen to not participate in a residual value guarantee program in
2012 and prior years, the 2012 impact would be substantially miti-
gated by the effect of prior year asset values being recognized as
operating lease revenue in the current year. The aggregate asset
values associated with the guarantees of direct financing leases
were $199 million and $44 million for the financing transactions
originated during the years ended December 31, 2012 and 2011,
respectively. The associated aggregate guaranteed future values
at the scheduled end of lease were $53 million and $43 million for
the financing transactions originated during the years ended
December 31, 2012 and 2011, respectively. The cost of guarantees
was $5 million and $4 million for the year ended December 31, 2012
and 2011, respectively.
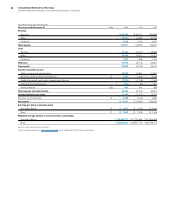
Unguaranteed Residual Value
($ in millions)
To t a l Estimated Run Out of 2012 Balance
At December 31: 2011 2012 2013 2014 2015
2016 and
Beyond
Sales-type and direct financing leases $ 745 $ 794 $166 $255 $228 $144
Operating leases 296 259 120 75 48 16
Total unguaranteed residual value $ 1,041 $ 1,053 $286 $330 $276 $160
Related original amount financed $18,635 $18,744
Percentage 5.6% 5.6%
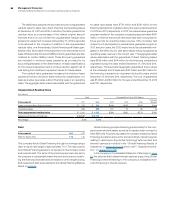
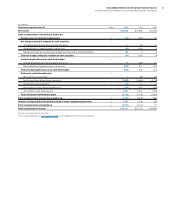
Debt
At December 31: 2012 2011
Debt-to-equity ratio 7.0x 7.2x
The company funds Global Financing through borrowings using a
debt-to-equity ratio target of approximately 7 to 1. The debt used to
fund Global Financing assets is composed of intercompany loans
and external debt. The terms of the intercompany loans are set by
the company to substantially match the term and currency underly-
ing the financing receivable and are based on arm’s-length pricing.
Both assets and debt are presented in the Global Financing Balance
Sheet on page 64.
Global Financing provides financing predominantly for the com-
pany’s external client assets, as well as for assets under contract by
other IBM units. As previously stated, the company measures Global
Financing as a stand-alone entity, and accordingly, interest expense
relating to debt supporting Global Financing’s external client and
internal business is included in the “Global Financing Results of
Operations” on pages 63 and 64 and in note T, “Segment Informa-
tion,” on pages 134 to 138.
In the company’s Consolidated Statement of Earnings on page
70, the external debt-related interest expense supporting Global
Financing’s internal financing to the company is reclassified from
cost of financing to interest expense.