IBM 2012 Annual Report Download - page 28
Download and view the complete annual report
Please find page 28 of the 2012 IBM annual report below. You can navigate through the pages in the report by either clicking on the pages listed below, or by using the keyword search tool below to find specific information within the annual report.-
 1
1 -
2
-
3
-
4
-
5
-
6
-
7
-
8
-
9
-
10
-
11
-
12
-
13
-
14
-
15
-
16
-
17
-
 18
18 -
 19
19 -
 20
20 -
 21
21 -
 22
22 -
 23
23 -
 24
24 -
 25
25 -
 26
26 -
 27
27 -
 28
28 -
 29
29 -
 30
30 -
 31
31 -
 32
32 -
 33
33 -
 34
34 -
 35
35 -
 36
36 -
 37
37 -
 38
38 -
39
-
40
-
41
-
42
-
43
-
44
-
45
-
46
-
47
-
48
-
49
-
50
-
51
-
52
-
53
-
54
-
55
-
56
-
57
-
58
-
59
-
60
-
61
-
62
-
63
-
64
-
65
-
66
-
67
-
68
-
69
-
70
-
71
-
72
-
73
-
74
-
75
-
76
-
77
-
78
-
79
-
80
-
81
-
82
-
83
-
84
-
85
-
86
-
87
-
88
-
89
-
90
-
91
-
92
-
93
-
94
-
95
-
96
-
97
-
98
-
99
-
100
-
101
-
102
-
103
-
104
-
105
-
106
-
107
-
108
-
109
-
110
-
111
-
112
-
113
-
114
-
115
-
116
-
117
-
118
-
119
-
120
-
121
-
122
-
123
-
124
-
125
-
126
-
127
-
128
-
129
-
130
-
131
-
132
-
133
-
134
-
135
-
136
-
137
-
138
-
139
-
140
-
141
-
142
-
143
-
144
-
145
-
146
 |
 |

27
Management Discussion
International Business Machines Corporation and Subsidiary Companies
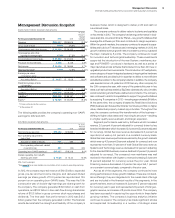
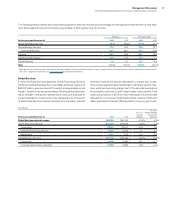
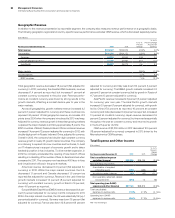
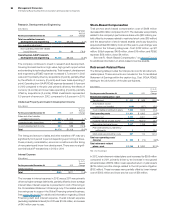
The following table presents each reportable segment’s external revenue as a percentage of total segment external revenue and each
reportable segment’s pre-tax income as a percentage of total segment pre-tax income.
Revenue Pre-tax Income*
For the year ended December 31: 2012 2011 2012 2011
Global Technology Services 38.7% 38.5%29.0% 27.4%
Global Business Services 17.9 18.2 12.4 13.1
Total Global Services 56.6 56.7 41.4 40.6
Software 24.5 23.5 45.0 43.5
Systems and Technology 17.0 17.9 5.1 7.1
Global Financing 1.9 2.0 8.5 8.8
To t a l 100.0% 100.0%100.0% 100.0%
* Segment pre-tax income includes transactions between segments that are intended to reflect an arm’s-length transfer price and excludes certain unallocated corporate items;
see note T, “Segment Information,” on pages 134 to 138 for additional information.
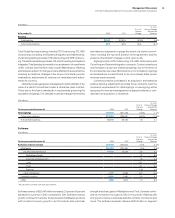
declined 4.0 percent (2 percent adjusted for currency) year to year.
The services segments also had strength in all the key growth initia-
tives, which are becoming a larger part of the services business as
the company continues to shift toward higher value content. Total
outsourcing revenue of $27,552 million decreased 2.6 percent (flat
adjusted for currency) and total transactional revenue of $23,907
million decreased 1.8 percent (flat adjusted for currency) year to year.
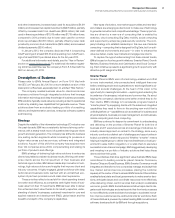
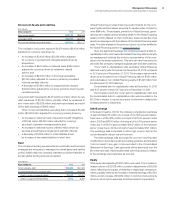
($ in millions)
For the year ended December 31: 2012 2011
Yr.-to-Yr.
Percent
Change
Yr.-to-Yr.
Percent Change
Adjusted for
Currency
Global Services external revenue $58,802 $60,163 (2.3)% 0.4%
Global Technology Services $40,236 $40,879 (1.6)% 1.3%
Outsourcing 23,344 23,911 (2.4)0.5
Integrated Technology Services 9,550 9,453 1.0 3.7
Maintenance 7,343 7,515 (2.3)0.6
Global Business Services $18,566 $19,284 (3.7)% (1.6)%
Outsourcing 4,209 4,390 (4.1)(1.7)
Consulting and Systems Integration 14,358 14,895 (3.6)(1.6)
Global Services
In 2012, the Global Services segments, Global Technology Services
(GTS) and Global Business Services (GBS), delivered revenue of
$58,802 million, grew pre-tax profit 7 percent and expanded pre-tax
margin 1.5 points on an as-reported basis. Revenue performance was
led by strength in the growth markets which were up 4.8 percent (9
percent adjusted for currency) and now represents over 20 percent
of total Global Services revenue. Revenue from the major markets