IBM 2012 Annual Report Download - page 102
Download and view the complete annual report
Please find page 102 of the 2012 IBM annual report below. You can navigate through the pages in the report by either clicking on the pages listed below, or by using the keyword search tool below to find specific information within the annual report.-
 1
1 -
2
-
3
-
4
-
5
-
6
-
7
-
8
-
9
-
10
-
11
-
12
-
13
-
14
-
15
-
16
-
17
-
18
-
19
-
20
-
21
-
22
-
23
-
24
-
25
-
26
-
27
-
28
-
29
-
30
-
31
-
32
-
33
-
34
-
35
-
36
-
37
-
38
-
39
-
40
-
41
-
42
-
43
-
44
-
45
-
46
-
47
-
48
-
49
-
50
-
51
-
52
-
53
-
54
-
55
-
56
-
57
-
58
-
59
-
60
-
61
-
62
-
63
-
64
-
65
-
66
-
67
-
68
-
69
-
70
-
71
-
72
-
73
-
74
-
75
-
76
-
77
-
78
-
79
-
80
-
81
-
82
-
83
-
84
-
85
-
86
-
87
-
88
-
89
-
90
-
91
-
 92
92 -
 93
93 -
 94
94 -
 95
95 -
 96
96 -
 97
97 -
 98
98 -
 99
99 -
 100
100 -
 101
101 -
 102
102 -
 103
103 -
 104
104 -
 105
105 -
 106
106 -
 107
107 -
 108
108 -
 109
109 -
 110
110 -
 111
111 -
 112
112 -
113
-
114
-
115
-
116
-
117
-
118
-
119
-
120
-
121
-
122
-
123
-
124
-
125
-
126
-
127
-
128
-
129
-
130
-
131
-
132
-
133
-
134
-
135
-
136
-
137
-
138
-
139
-
140
-
141
-
142
-
143
-
144
-
145
-
146
 |
 |

Notes to Consolidated Financial Statements
International Business Machines Corporation and Subsidiary Companies
101
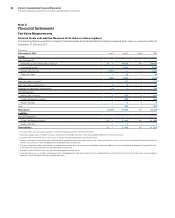
Lease Receivables
($ in millions)
At December 31, 2012:
Major
Markets
Growth
Markets
Credit rating
Aaa – Aa3 $ 646 $ 86
A1 – A3 1,664 223
Baa1 – Baa3 2,285 776
Ba1 – Ba2 1,367 450
Ba3 – B1 552 418
B2 – B3 399 127
Caa – D 124 58
To t a l $7,036 $2,138
Loan Receivables
($ in millions)
At December 31, 2012:
Major
Markets
Growth
Markets
Credit rating
Aaa – Aa3 $ 887 $ 148
A1 – A3 2,286 382
Baa1 – Baa3 3,139 1,333
Ba1 – Ba2 1,878 773
Ba3 – B1 758 718
B2 – B3 548 218
Caa – D 170 99
To t a l $9,666 $3,670
At December 31, 2012, the industries which made up Global Financing’s
receivables portfolio consist of: Financial (38 percent), Government
(16 percent), Manufacturing (14 percent), Retail (9 percent), Services
(7 percent), Healthcare (6 percent), Communications (6 percent) and
Other (4 percent).
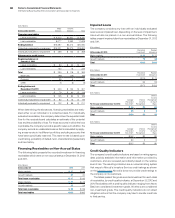
Lease Receivables
($ in millions)
At December 31, 2011:
Major
Markets
Growth
Markets
Credit rating
Aaa – Aa3 $ 697 $ 139
A1 – A3 1,459 306
Baa1 – Baa3 2,334 654
Ba1 – Ba2 1,118 457
Ba3 – B1 534 252
B2 – B3 260 97
Caa – D 108 15
To t a l $6,510 $1,921
Loan Receivables
($ in millions)
At December 31, 2011:
Major
Markets
Growth
Markets
Credit rating
Aaa – Aa3 $ 971 $ 185
A1 – A3 2,034 407
Baa1 – Baa3 3,255 869
Ba1 – Ba2 1,559 607
Ba3 – B1 744 335
B2 – B3 362 129
Caa – D 151 20
To t a l $9,077 $2,552
At December 31, 2011, the industries which made up Global Financing’s
receivables portfolio consist of: Financial (39 percent), Government
(15 percent), Manufacturing (13 percent), Retail (9 percent), Services
(7 percent), Healthcare (6 percent), Communications (6 percent) and
Other (5 percent).
Past Due Financing Receivables
($ in millions)
At December 31, 2012:
Tota l
Past Due
> 90 Days* Current
Tota l
Financing
Receivables
Recorded
Investment
> 90 Days
and Accruing
Major markets $ 8 $ 7,028 $ 7,036 $ 5
Growth markets 11 2,127 2,138 8
Total lease receivables $20 $ 9,154 $ 9,174 $13
Major markets $27 $ 9,639 $ 9,666 $ 8
Growth markets 36 3,634 3,670 31
Total loan receivables $63 $13,273 $13,336 $39
To t a l $82 $22,428 $22,510 $52
* Does not include accounts that are fully reserved.