IBM 2012 Annual Report Download - page 68
Download and view the complete annual report
Please find page 68 of the 2012 IBM annual report below. You can navigate through the pages in the report by either clicking on the pages listed below, or by using the keyword search tool below to find specific information within the annual report.-
 1
1 -
2
-
3
-
4
-
5
-
6
-
7
-
8
-
9
-
10
-
11
-
12
-
13
-
14
-
15
-
16
-
17
-
18
-
19
-
20
-
21
-
22
-
23
-
24
-
25
-
26
-
27
-
28
-
29
-
30
-
31
-
32
-
33
-
34
-
35
-
36
-
37
-
38
-
39
-
40
-
41
-
42
-
43
-
44
-
45
-
46
-
47
-
48
-
49
-
50
-
51
-
52
-
53
-
54
-
55
-
56
-
57
-
 58
58 -
 59
59 -
 60
60 -
 61
61 -
 62
62 -
 63
63 -
 64
64 -
 65
65 -
 66
66 -
 67
67 -
 68
68 -
 69
69 -
 70
70 -
 71
71 -
 72
72 -
 73
73 -
 74
74 -
 75
75 -
 76
76 -
 77
77 -
 78
78 -
79
-
80
-
81
-
82
-
83
-
84
-
85
-
86
-
87
-
88
-
89
-
90
-
91
-
92
-
93
-
94
-
95
-
96
-
97
-
98
-
99
-
100
-
101
-
102
-
103
-
104
-
105
-
106
-
107
-
108
-
109
-
110
-
111
-
112
-
113
-
114
-
115
-
116
-
117
-
118
-
119
-
120
-
121
-
122
-
123
-
124
-
125
-
126
-
127
-
128
-
129
-
130
-
131
-
132
-
133
-
134
-
135
-
136
-
137
-
138
-
139
-
140
-
141
-
142
-
143
-
144
-
145
-
146
 |
 |
67
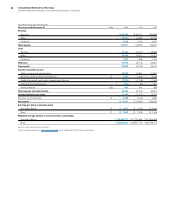
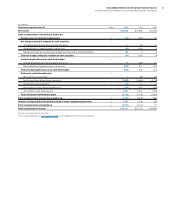
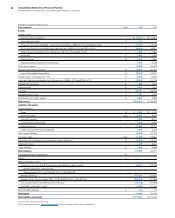
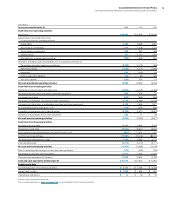
Management Discussion
International Business Machines Corporation and Subsidiary Companies
Liquidity and Capital Resources
Global Financing is a segment of the company, and therefore is sup-
ported by the company’s overall liquidity position and access to
capital markets. Cash generated by Global Financing was primarily
deployed to pay intercompany payables and dividends to the com-
pany in order to maintain an appropriate debt-to-equity ratio.
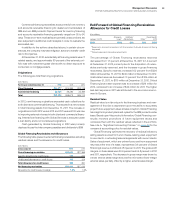
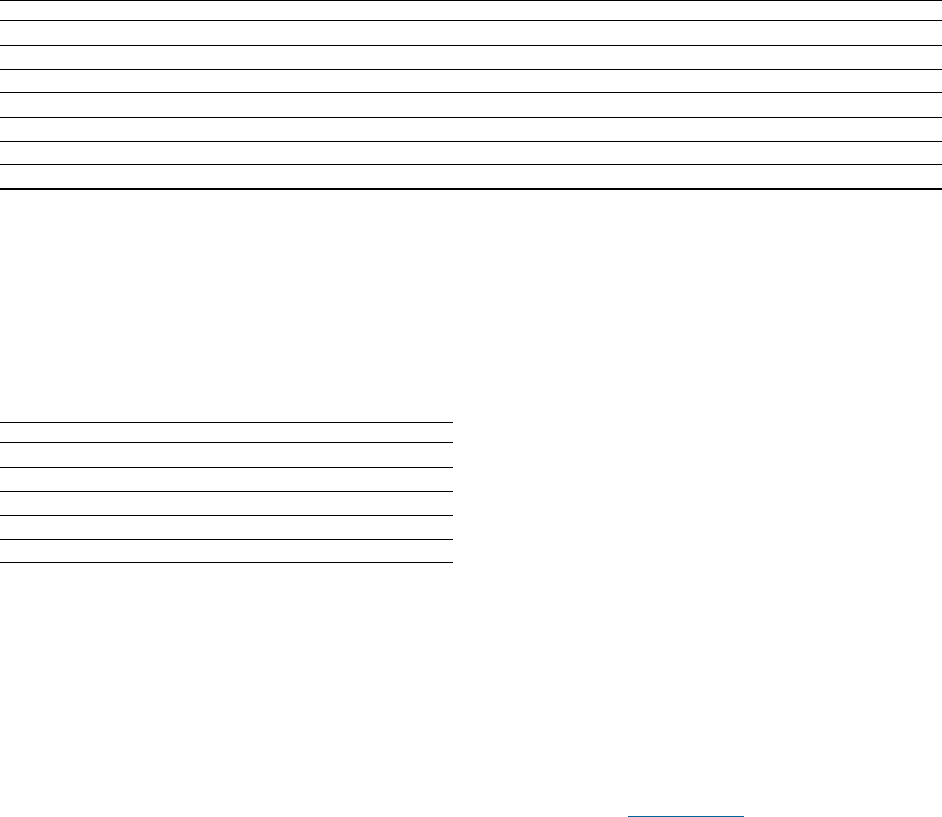
Return on Equity
($ in millions)
At December 31: 2012 2011
Numerator
Global Financing after-tax income
(a)*$1,362 $1,338
Denominator
Average Global Financing equity
(b)** $3,322 $3,286
Global Financing return on equity
(a) /(b) 41.0% 40.7%
* Calculated based upon an estimated tax rate principally based on Global Financing’s
geographic mix of earnings as IBM’s provision for income taxes is determined on a
consolidated basis.
** Average of the ending equity for Global Financing for the last five quarters.
Looking Forward
Global Financing’s financial position provides flexibility and funding
capacity which enables the company to be well positioned in the
current environment. Global Financing’s assets and new financing
volumes are primarily IBM products and services financed to the
company’s clients and business partners, and substantially all
financing assets are IT related assets which provide a stable base
of business for future growth. Global Financing’s offerings are com-
petitive and available to clients as a result of the company’s
borrowing cost and access to the capital markets. Overall, Global
Financing’s originations will be dependent upon the demand for IT
products and services as well as client participation rates.
IBM continues to access both the short-term commercial paper
market and the medium- and long-term debt markets. A protracted
period where IBM could not access the capital markets would likely
lead to a slowdown in originations.
Interest rates and the overall economy (including currency fluc-
tuations) will have an effect on both revenue and gross profit. The
company’s interest rate risk management policy, however, combined
with the Global Financing pricing strategy should mitigate gross
margin erosion due to changes in interest rates.
The economy could impact the credit quality of the Global
Financing receivables portfolio and therefore the level of provision
for credit losses. Global Financing will continue to apply rigorous
credit policies in both the origination of new business and the evalu-
ation of the existing portfolio.
As discussed on pages 65 and 66, Global Financing has histori-
cally been able to manage residual value risk both through insight
into the company’s product cycles, as well as through its remarketing
business.
Global Financing has policies in place to manage each of the
key risks involved in financing. These policies, combined with prod-
uct and client knowledge, should allow for the prudent management
of the business going forward, even during periods of uncertainty
with respect to the global economy.
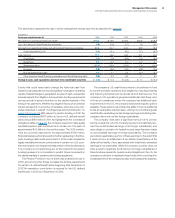
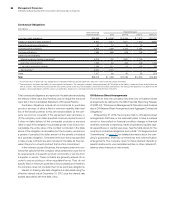
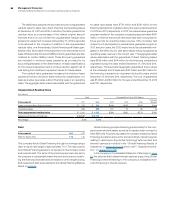
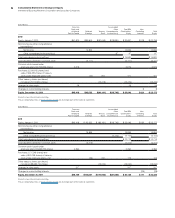
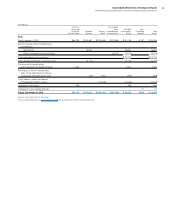
The following table provides additional information on total company debt. In this table, intercompany activity includes internal loans and
leases at arm’s-length pricing in support of Global Services’ long-term contracts and other internal activity. The company believes these
assets should be appropriately leveraged in line with the overall Global Financing business model.
($ in millions)
December 31, 2012 December 31, 2011
Global Financing Segment $24,501 $23,332
Debt to support external clients $21,583 $20,051
Debt to support internal clients 2,919 3,281
Non-Global Financing Segments 8,767 7,987
Debt supporting operations 11,686 11,269
Intercompany activity (2,919) (3,281)
Total company debt $33,269 $31,320