IBM 2012 Annual Report Download - page 139
Download and view the complete annual report
Please find page 139 of the 2012 IBM annual report below. You can navigate through the pages in the report by either clicking on the pages listed below, or by using the keyword search tool below to find specific information within the annual report.-
 1
1 -
2
-
3
-
4
-
5
-
6
-
7
-
8
-
9
-
10
-
11
-
12
-
13
-
14
-
15
-
16
-
17
-
18
-
19
-
20
-
21
-
22
-
23
-
24
-
25
-
26
-
27
-
28
-
29
-
30
-
31
-
32
-
33
-
34
-
35
-
36
-
37
-
38
-
39
-
40
-
41
-
42
-
43
-
44
-
45
-
46
-
47
-
48
-
49
-
50
-
51
-
52
-
53
-
54
-
55
-
56
-
57
-
58
-
59
-
60
-
61
-
62
-
63
-
64
-
65
-
66
-
67
-
68
-
69
-
70
-
71
-
72
-
73
-
74
-
75
-
76
-
77
-
78
-
79
-
80
-
81
-
82
-
83
-
84
-
85
-
86
-
87
-
88
-
89
-
90
-
91
-
92
-
93
-
94
-
95
-
96
-
97
-
98
-
99
-
100
-
101
-
102
-
103
-
104
-
105
-
106
-
107
-
108
-
109
-
110
-
111
-
112
-
113
-
114
-
115
-
116
-
117
-
118
-
119
-
120
-
121
-
122
-
123
-
124
-
125
-
126
-
127
-
128
-
 129
129 -
 130
130 -
 131
131 -
 132
132 -
 133
133 -
 134
134 -
 135
135 -
 136
136 -
 137
137 -
 138
138 -
 139
139 -
 140
140 -
 141
141 -
 142
142 -
 143
143 -
 144
144 -
 145
145 -
 146
146
 |
 |

138 Notes to Consolidated Financial Statements
International Business Machines Corporation and Subsidiary Companies
138
Reconciliations of IBM as Reported
($ in millions)
At December 31: 2012 2011 2010
Assets
Total reportable segments $ 97,310 $ 91,557 $ 89,292
Elimination of internal transactions (4,943) (5,407)(5,515)
Unallocated amounts
Cash and marketable securities 9,779 10,575 10,113
Notes and accounts receivable 3,769 3,526 3,762
Deferred tax assets 5,194 4,865 4,494
Plant, other property
and equipment 2,555 2,918 3,067
Pension assets 945 2,837 3,060
Other 4,604 5,562 5,178
Total IBM consolidated assets $119,213 $116,433 $113,452
Major Clients
No single client represented 10 percent or more of the company’s
total revenue in 2012, 2011 or 2010.
Geographic Information
The following provides information for those countries that are
10 percent or more of the specific category.
Revenue*
($ in millions)
For the year ended December 31: 2012 2011 2010
United States $ 36,270 $ 37,041 $35,581
Japan 10,697 10,968 10,701
Other countries 57,540 58,906 53,589
Total IBM consolidated revenue $104,507 $106,916 $99,870
* Revenues are attributed to countries based on the location of the client.
Plant and Other Property-Net
($ in millions)
At December 31: 2012 2011 2010
United States $ 6,555 $ 6,271 $ 6,134
Other countries 6,299 6,186 6,298
To t a l $12,854 $12,457 $12,432
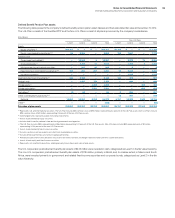
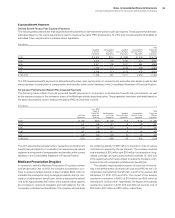
Revenue by Classes of
Similar Products or Services
The following table presents external revenue for similar classes of
products or services within the company’s reportable segments.
Within Global Technology Services and Global Business Services,
client solutions often include IBM software and systems and other
suppliers’ products if the client solution requires it. Within Software,
product license charges and ongoing subscription and support are
reported as Software, and software as a service, consulting, educa-
tion, training and other product-related services are reported as
Services. Within Systems and Technology, Microelectronics original
equipment manufacturer (OEM) revenue is primarily from the sale
of semiconductors. Microelectronics Services revenue includes
circuit and component design services and technology and manu-
facturing consulting services. See “Description of the Business,”
beginning on page 21 for additional information.
($ in millions)
For the year ended December 31: 2012 2011 2010
Global Technology Services
Services $31,161 $31,746 $29,367
Maintenance 7,343 7,515 7,250
Systems 1,574 1,478 1,409
Software 159 140 175
Global Business Services
Services $18,216 $18,956 $17,858
Software 208 211 236
Systems 142 118 129
Software
Software $23,144 $22,921 $20,882
Services 2,304 2,022 1,603
Systems and Technology
Servers $11,980 $12,362 $11,619
Storage 3,411 3,619 3,420
Microelectronics OEM 1,572 1,975 1,938
Retail Store Solutions 357 753 674
Microelectronics Services 346 277 321
Global Financing
Financing $ 1,471 $ 1,612 $ 1,580
Used equipment sales 542 490 659
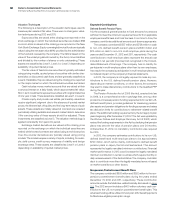
Note U.
Subsequent Events
On January 2, 2013, the American Taxpayer Relief Act of 2012
was signed into law extending several business tax provisions
through 2013. Certain of these provisions were reinstated retroac-
tively to January 1, 2012. Accounting guidance requires that the
effects of new legislation be recognized upon enactment. Accord-
ingly, the 2012 retroactive impact of the legislation, which is a tax
benefit of approximately $135 million, will be included in the com-
pany’s first-quarter 2013 tax provision.
On January 29, 2013, the company announced that the Board
of Directors approved a quarterly dividend of $0.85 per common
share. The dividend is payable March 9, 2013 to shareholders of
record on February 8, 2013.
On February 5, 2013, the company issued $1 billion of 5-year
fixed-rate bonds with a 1.25 percent coupon, and $1 billion of 2-year
floating-rate bonds priced at three month London Interbank Offered
Rate (LIBOR) minus two basis points.