IBM 2012 Annual Report Download - page 54
Download and view the complete annual report
Please find page 54 of the 2012 IBM annual report below. You can navigate through the pages in the report by either clicking on the pages listed below, or by using the keyword search tool below to find specific information within the annual report.-
 1
1 -
2
-
3
-
4
-
5
-
6
-
7
-
8
-
9
-
10
-
11
-
12
-
13
-
14
-
15
-
16
-
17
-
18
-
19
-
20
-
21
-
22
-
23
-
24
-
25
-
26
-
27
-
28
-
29
-
30
-
31
-
32
-
33
-
34
-
35
-
36
-
37
-
38
-
39
-
40
-
41
-
42
-
43
-
 44
44 -
 45
45 -
 46
46 -
 47
47 -
 48
48 -
 49
49 -
 50
50 -
 51
51 -
 52
52 -
 53
53 -
 54
54 -
 55
55 -
 56
56 -
 57
57 -
 58
58 -
 59
59 -
 60
60 -
 61
61 -
 62
62 -
 63
63 -
 64
64 -
65
-
66
-
67
-
68
-
69
-
70
-
71
-
72
-
73
-
74
-
75
-
76
-
77
-
78
-
79
-
80
-
81
-
82
-
83
-
84
-
85
-
86
-
87
-
88
-
89
-
90
-
91
-
92
-
93
-
94
-
95
-
96
-
97
-
98
-
99
-
100
-
101
-
102
-
103
-
104
-
105
-
106
-
107
-
108
-
109
-
110
-
111
-
112
-
113
-
114
-
115
-
116
-
117
-
118
-
119
-
120
-
121
-
122
-
123
-
124
-
125
-
126
-
127
-
128
-
129
-
130
-
131
-
132
-
133
-
134
-
135
-
136
-
137
-
138
-
139
-
140
-
141
-
142
-
143
-
144
-
145
-
146
 |
 |

53
Management Discussion
International Business Machines Corporation and Subsidiary Companies
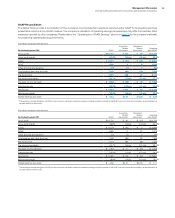
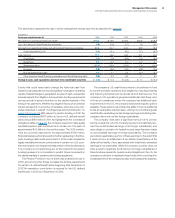
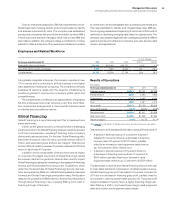
Intellectual Property and Custom Development Income
($ in millions)
For the year ended December 31: 2011 2010
Yr.-to-Yr.
Percent
Change
Sales and other transfers of
intellectual property $ 309 $ 203 52.3%
Licensing/royalty-based fees 211 312 (32.5)
Custom development income 588 638 (8.0)
To t a l $1,108 $1,154 (4.0)%
The timing and amount of sales and other transfers of IP may
vary significantly from period to period depending upon timing of
divestitures, industry consolidation, economic conditions and the
timing of new patents and know-how development. There were no
significant individual IP transactions in 2011 or 2010.
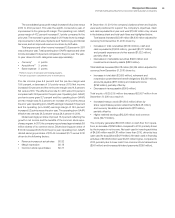
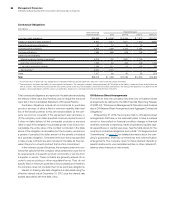
Interest Expense
($ in millions)
For the year ended December 31: 2011 2010
Yr.-to-Yr.
Percent
Change
Interest expense
To t a l $411 $368 11.6%
The increase in interest expense in 2011 versus 2010 was primarily
driven by higher average debt levels, partially offset by lower average
interest rates. Interest expense is presented in cost of financing in
the Consolidated State ment of Earnings only if the related external
borrowings are to support the Global Financing external business.
See pages 66 and 67 for additional information regarding Global
Financing debt and interest expense. Overall interest expense
(excluding capitalized interest) for 2011 was $964 million, an increase
of $41 million year to year.
Income Taxes
The effective tax rate for 2011 was 24.5 percent compared with
24.8 percent in 2010. The operating (non-GAAP) tax rate for 2011
was 24.5 percent compared with 24.4 percent in 2010. The 0.3 point
decrease in the as-reported effective tax rate was primarily driven
by a more favorable geographic mix of pre-tax earnings (0.6 points),
the lack of prior year impacts related to certain intercompany pay-
ments made by foreign subsidiaries (6.6 points) and a reduced
impact associated with the intercompany licensing of certain intel-
lectual property and acquisition integration costs (2.2 points). These
benefits were offset by a decrease in the utilization of foreign tax
credits (3.7 points) and a decrease in the benefits associated with
the settlements of the U.S. federal income tax audit (5.5 points).
The remaining items were individually insignificant.
Financial Position
Cash and cash equivalents at year end was $11,922 million, an
increase of $271 million from the prior year-end position. During
2011, the company continued to manage its investment portfolio
to meet its capital preservation and liquidity objectives, which
resulted in a shift to higher rated institutions. At year end, a signifi-
cant portion of the investment portfolio was invested in U.S.
sovereign instruments with no holdings of European sovereign debt
securities.
Total debt of $31,320 million increased $2,695 million from
the prior year-end level. The commercial paper balance at
December 31, 2011 was $2,300 million, an increase of $1,156 million
from the prior year. Within total debt, $23,332 million is in support
of the Global Financing business which is leveraged at a 7.2 to 1
ratio. The company continued to have substantial flexibility in the
market. During 2011, the company completed bond issuances
totaling $4,850 million, with terms ranging from three to 10 years
and priced from 0.875 to 2.90 percent depending on the maturity.
In addition, the company renewed its $10 billion global credit facility
for five years, with 100 percent of the facility available on a same
day basis.
Consistent with accounting standards the company remeasured
the funded status of its retirement and postretirement plans at
December 31. At December 31, 2011, the overall net underfunded
position was $16,389 million, an increase of $2,654 million from
December 31, 2010 as the increase in the benefit obligation due to
the reduction in discount rates more than offset the returns on plan
assets. At year end, the company’s qualified defined benefit plans
were well funded and its cash requirements related to these plans
remained stable going forward. In 2011, the return on the U.S.
Personal Pension Plan assets was 8.4 percent and the plan was
98 percent funded. Overall, global asset returns were 6.1 percent and
the company’s qualified defined benefit plans worldwide were 96
percent funded.
The company’s qualified defined benefit plans do hold European
sovereign debt securities in their trust funds. See note S, “Retire-
ment-Related Benefits,” on page 128 for additional information.
During 2011, the company generated $19,846 million in cash from
operations, an increase of $298 million compared to 2010. In addi-
tion, the company generated $16,604 million in free cash flow in
2011, an increase of $305 million over the prior year. See pages 56
and 57 for additional information on free cash flow. The company
returned $18,519 million to shareholders in 2011, with $15,046 million
in gross share repurchases and $3,473 million in dividends. In 2011,
the company repurchased approximately 89 million shares and had
$8.7 billion remaining in share repurchase authorization at year end.
The company has consistently generated strong cash from opera-
tions and strong free cash flow and this permits the company to
invest and deploy capital to areas with the most attractive long-term
opportunities.