IBM 2012 Annual Report Download - page 126
Download and view the complete annual report
Please find page 126 of the 2012 IBM annual report below. You can navigate through the pages in the report by either clicking on the pages listed below, or by using the keyword search tool below to find specific information within the annual report.-
 1
1 -
2
-
3
-
4
-
5
-
6
-
7
-
8
-
9
-
10
-
11
-
12
-
13
-
14
-
15
-
16
-
17
-
18
-
19
-
20
-
21
-
22
-
23
-
24
-
25
-
26
-
27
-
28
-
29
-
30
-
31
-
32
-
33
-
34
-
35
-
36
-
37
-
38
-
39
-
40
-
41
-
42
-
43
-
44
-
45
-
46
-
47
-
48
-
49
-
50
-
51
-
52
-
53
-
54
-
55
-
56
-
57
-
58
-
59
-
60
-
61
-
62
-
63
-
64
-
65
-
66
-
67
-
68
-
69
-
70
-
71
-
72
-
73
-
74
-
75
-
76
-
77
-
78
-
79
-
80
-
81
-
82
-
83
-
84
-
85
-
86
-
87
-
88
-
89
-
90
-
91
-
92
-
93
-
94
-
95
-
96
-
97
-
98
-
99
-
100
-
101
-
102
-
103
-
104
-
105
-
106
-
107
-
108
-
109
-
110
-
111
-
112
-
113
-
114
-
115
-
 116
116 -
 117
117 -
 118
118 -
 119
119 -
 120
120 -
 121
121 -
 122
122 -
 123
123 -
 124
124 -
 125
125 -
 126
126 -
 127
127 -
 128
128 -
 129
129 -
 130
130 -
 131
131 -
 132
132 -
 133
133 -
 134
134 -
 135
135 -
 136
136 -
137
-
138
-
139
-
140
-
141
-
142
-
143
-
144
-
145
-
146
 |
 |

Notes to Consolidated Financial Statements
International Business Machines Corporation and Subsidiary Companies
125
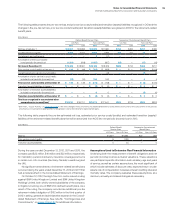
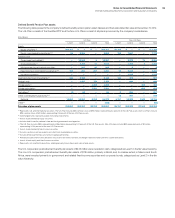
The following table presents the pre-tax net loss and prior service costs/(credits) and transition (assets)/liabilities recognized in OCI and the
changes in the pre-tax net loss, prior service costs/(credits) and transition (assets)/liabilities recognized in AOCI for the retirement-related
benefit plans.
($ in millions)
Defined Benefit Pension Plans Nonpension Postretirement Benefit Plans
U.S. Plans Non-U.S. Plans U.S. Plan Non-U.S. Plans
2012 2011 2012 2011 2012 2011 2012 2011
Net loss at January 1 $18,561 $15,865 $18,309 $17,580 $734 $492 $211 $180
Current period loss/(gain) 2,258 3,514 4,905 1,696 104 241 75 45
Curtailments and settlements ——2(11) ————
Amortization of net loss included
in net periodic (income)/cost (1,331) (818) (1,027) (957) (32) —(17) (13)
Net loss at December 31 $19,488 $18,561 $22,188 $18,309 $806 $734 $269 $211
Prior service costs/(credits) at January 1 $ 139 $ 149 $ (768) $ (958)$ — $ — $ (10) $ (14)
Current period prior service costs/(credits) ———28 ——(0) (0)
Amortization of prior service (costs)/credits
included in net periodic (income)/cost (10) (10)154 162 ——44
Prior service costs/(credits) at December 31 $ 130 $ 139 $ (614) $ (768) $ — $ — $ (6) $ (10)
Transition (assets)/liabilities at January 1 $ — $ — $ (0) $ (0) $ — $ — $ 0 $ 1
Amortization of transition assets/(liabilities)
included in net periodic (income)/cost ——00——(0) (0)
Transition (assets)/liabilities at December 31 $ — $ — $ (0) $ (0) $ — $ — $ 0 $ 0
Total loss recognized in accumulated other
comprehensive income/(loss)*$19,618 $18,701 $21,574 $17,541 $806 $734 $263 $202
*
See note L, “Equity Activity,” on pages 107 to 110 for the total change in AOCI, and the Consolidated Statement of Comprehensive Income for the components of net periodic
(income)/cost, including the related tax effects, recognized in OCI for the retirement-related benefit plans.
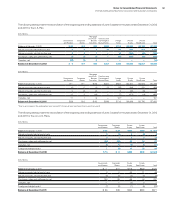
The following table presents the pre-tax estimated net loss, estimated prior service costs/(credits) and estimated transition (assets)/
liabilities of the retirement-related benefit plans that will be amortized from AOCI into net periodic (income)/cost in 2013.
($ in millions)
Defined Benefit
Pension Plans
Nonpension Postretirement
Benefit Plans
U.S. Plans Non-U.S. Plans U.S. Plan Non-U.S. Plans
Net loss $1,804 $1,693 $33 $26
Prior service costs/(credits) 9 (132) — (4)
Transition (assets)/liabilities 0 (0) — 0
During the years ended December 31, 2012, 2011 and 2010, the
company paid $22 million, $16 million and $22 million, respectively,
for mandatory pension insolvency insurance coverage premiums
in certain non-U.S. countries (Germany, Canada, Luxembourg and
the UK).
No significant amendments of retirement-related benefit plans
occurred during the years ended December 31, 2012 and 2011 that
had a material effect in the Consolidated Statement of Earnings.
On October 12, 2012, the High Court in London issued a ruling
against IBM United Kingdom Limited and IBM United Kingdom
Holdings Limited, both wholly-owned subsidiaries of the company,
in litigation involving one of IBM UK’s defined benefit plans. As a
result of the ruling, the company recorded an additional pre-tax
retirement-related obligation of $162 million in the third quarter of
2012 in selling, general and administrative expense in the Consoli-
dated Statement of Earnings. See note M, “Contingencies and
Commitments,” on pages 111 and 112 for additional information.
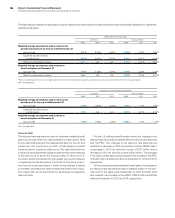
Assumptions Used to Determine Plan Financial Information
Underlying both the measurement of benefit obligations and net
periodic (income)/cost are actuarial valuations. These valuations
use participant-specific information such as salary, age and years
of service, as well as certain assumptions, the most significant of
which include estimates of discount rates, expected return on plan
assets, rate of compensation increases, interest crediting rates and
mortality rates. The company evaluates these assumptions, at a
minimum, annually, and makes changes as necessary.