IBM 2012 Annual Report Download - page 134
Download and view the complete annual report
Please find page 134 of the 2012 IBM annual report below. You can navigate through the pages in the report by either clicking on the pages listed below, or by using the keyword search tool below to find specific information within the annual report.-
 1
1 -
2
-
3
-
4
-
5
-
6
-
7
-
8
-
9
-
10
-
11
-
12
-
13
-
14
-
15
-
16
-
17
-
18
-
19
-
20
-
21
-
22
-
23
-
24
-
25
-
26
-
27
-
28
-
29
-
30
-
31
-
32
-
33
-
34
-
35
-
36
-
37
-
38
-
39
-
40
-
41
-
42
-
43
-
44
-
45
-
46
-
47
-
48
-
49
-
50
-
51
-
52
-
53
-
54
-
55
-
56
-
57
-
58
-
59
-
60
-
61
-
62
-
63
-
64
-
65
-
66
-
67
-
68
-
69
-
70
-
71
-
72
-
73
-
74
-
75
-
76
-
77
-
78
-
79
-
80
-
81
-
82
-
83
-
84
-
85
-
86
-
87
-
88
-
89
-
90
-
91
-
92
-
93
-
94
-
95
-
96
-
97
-
98
-
99
-
100
-
101
-
102
-
103
-
104
-
105
-
106
-
107
-
108
-
109
-
110
-
111
-
112
-
113
-
114
-
115
-
116
-
117
-
118
-
119
-
120
-
121
-
122
-
123
-
 124
124 -
 125
125 -
 126
126 -
 127
127 -
 128
128 -
 129
129 -
 130
130 -
 131
131 -
 132
132 -
 133
133 -
 134
134 -
 135
135 -
 136
136 -
 137
137 -
 138
138 -
 139
139 -
 140
140 -
 141
141 -
 142
142 -
 143
143 -
 144
144 -
145
-
146
 |
 |

Notes to Consolidated Financial Statements
International Business Machines Corporation and Subsidiary Companies
133
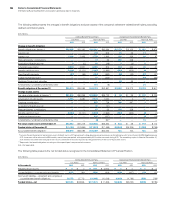
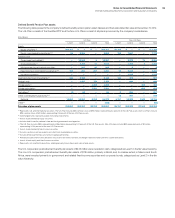
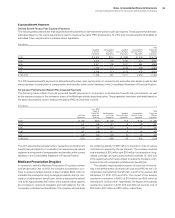
Expected Benefit Payments
Defined Benefit Pension Plan Expected Payments
The following table presents the total expected benefit payments to defined benefit pension plan participants. These payments have been
estimated based on the same assumptions used to measure the plans’ PBO at December 31, 2012 and include benefits attributable to
estimated future compensation increases, where applicable.
($ in millions)
Qualified
U.S. Plan
Payments
Nonqualified
U.S. Plans
Payments
Qualified
Non-U.S. Plans
Payments
Nonqualified
Non-U.S. Plans
Payments
Tota l
Expected
Benefit
Payments
2013 $ 3,303 $104 $ 1,993 $ 378 $ 5,778
2014 3,342 106 2,040 373 5,861
2015 3,407 108 2,011 382 5,908
2016 3,438 112 2,049 389 5,988
2017 3,418 113 2,073 400 6,004
2018–2022 17,436 597 11,071 2,252 31,356
The 2013 expected benefit payments to defined benefit pension plan participants not covered by the respective plan assets (underfunded
plans) represent a component of compensation and benefits, within current liabilities, in the Consolidated Statement of Financial Position.
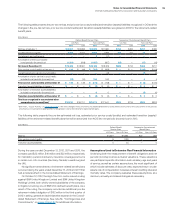
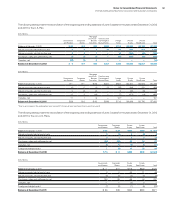
Nonpension Postretirement Benefit Plan Expected Payments
The following table reflects the total expected benefit payments to nonpension postretirement benefit plan participants, as well
as the expected receipt of the company’s share of the Medicare subsidy described below. These payments have been estimated based on
the same assumptions used to measure the plan’s APBO at December 31, 2012.
($ in millions)
U.S. Plan
Payments
Less: IBM
Share of
Expected
Medicare
Subsidy
Net Expected
U.S. Plan
Payments
Qualified
Non-U.S. Plans
Payments
Nonqualified
Non-U.S. Plans
Payments
Tota l
Expected
Benefit
Payments
2013 $ 462 $(24) $ 438 $ 8 $ 34 $ 480
2014 447 (26) 421 8 38 467
2015 446 (26) 420 8 41 470
2016 437 (25) 412 9 44 465
2017 429 (24) 405 10 48 463
2018–2022 1,979 (21) 1,958 55 305 2,318
The 2013 expected benefit payments to nonpension postretirement
benefit plan participants not covered by the respective plan assets
represent a component of compensation and benefits, within current
liabilities, in the Consolidated Statement of Financial Position.
Medicare Prescription Drug Act
In connection with the Medicare Prescription Drug Improvement
and Modernization Act of 2003, the company is expected to con-
tinue to receive a federal subsidy of approximately $298 million to
subsidize the prescription drug coverage provided by the U.S. non-
pension postretirement benefit plan, which is expected to extend
until 2018. Approx imately $147 million of the subsidy will be used by
the company to reduce its obligation and cost related to the U.S.
nonpension postretirement benefit plan. The company will contribute
the remaining subsidy of $151 million to the plan in order to reduce
contributions required by the participants. The company received
total subsidies of $53 million and $36 million for prescription drug-
related coverage during the years ended December 31, 2012 and
2011, respectively, which were utilized to reduce the company contri-
butions to the U.S. nonpension postretirement benefit plan.
The company has included the impact of its portion of the sub-
sidy in the determination of net periodic cost and APBO for the U.S.
nonpension postretirement benefit plan at and for the years ended
December 31, 2012, 2011 and 2010. The impact of the subsidy
resulted in a reduction in APBO of $134 million and $93 million at
December 31, 2012 and 2011, respectively. The impact of the subsidy
resulted in a reduction in 2012, 2011 and 2010 net periodic cost of
$35 million, $37 million and $19 million, respectively.