IBM 2012 Annual Report Download - page 40
Download and view the complete annual report
Please find page 40 of the 2012 IBM annual report below. You can navigate through the pages in the report by either clicking on the pages listed below, or by using the keyword search tool below to find specific information within the annual report.-
 1
1 -
2
-
3
-
4
-
5
-
6
-
7
-
8
-
9
-
10
-
11
-
12
-
13
-
14
-
15
-
16
-
17
-
18
-
19
-
20
-
21
-
22
-
23
-
24
-
25
-
26
-
27
-
28
-
29
-
 30
30 -
 31
31 -
 32
32 -
 33
33 -
 34
34 -
 35
35 -
 36
36 -
 37
37 -
 38
38 -
 39
39 -
 40
40 -
 41
41 -
 42
42 -
 43
43 -
 44
44 -
 45
45 -
 46
46 -
 47
47 -
 48
48 -
 49
49 -
 50
50 -
51
-
52
-
53
-
54
-
55
-
56
-
57
-
58
-
59
-
60
-
61
-
62
-
63
-
64
-
65
-
66
-
67
-
68
-
69
-
70
-
71
-
72
-
73
-
74
-
75
-
76
-
77
-
78
-
79
-
80
-
81
-
82
-
83
-
84
-
85
-
86
-
87
-
88
-
89
-
90
-
91
-
92
-
93
-
94
-
95
-
96
-
97
-
98
-
99
-
100
-
101
-
102
-
103
-
104
-
105
-
106
-
107
-
108
-
109
-
110
-
111
-
112
-
113
-
114
-
115
-
116
-
117
-
118
-
119
-
120
-
121
-
122
-
123
-
124
-
125
-
126
-
127
-
128
-
129
-
130
-
131
-
132
-
133
-
134
-
135
-
136
-
137
-
138
-
139
-
140
-
141
-
142
-
143
-
144
-
145
-
146
 |
 |

39
Management Discussion
International Business Machines Corporation and Subsidiary Companies
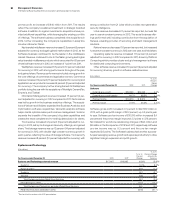
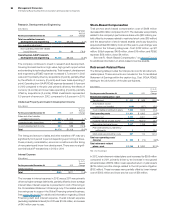
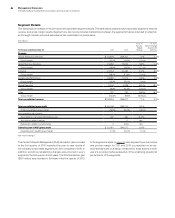
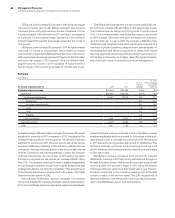
Consolidated Fourth-Quarter Results
($ and shares in millions except per share amounts)
For the fourth quarter: 2012 2011
Yr.-to-Yr.
Percent/
Margin
Change
Revenue $29,304 $29,486 (0.6)%*
Gross profit margin 51.8% 49.9% 1.8 pts.
Total expense and other income $ 7,336 $ 7,448 (1.5)%
Total expense and other
income-to-revenue ratio 25.0% 25.3% (0.2 ) pts.
Income before income taxes $ 7,831 $ 7,274 7.7%
Provision for income taxes 1,998 1,784 12.0%
Net income $ 5,833 $ 5,490 6.3%
Net income margin 19.9% 18.6%1.3 pts.
Earnings per share of common stock
Assuming dilution $ 5.13 $ 4.62 11.0%
Weighted-average shares outstanding
Assuming dilution 1,136.4 1,188.7 (4.4)%
* 0.3 percent adjusted for currency.
The following table provides the company’s operating (non-GAAP)
earnings for the fourth quarter of 2012 and 2011.
($ in millions except per share amounts)
For the fourth quarter: 2012 2011
Yr.-to-Yr.
Percent
Change
Net income as reported $5,833 $5,490 6.3%
Non-operating adjustments (net of tax)
Acquisition-related charges 243 119 103.4
Non-operating retirement-related
costs/(income) 53 (12)NM
Operating (non-GAAP) earnings* $6,129 $ 5,597 9.5%
Diluted operating (non-GAAP)
earnings per share $ 5.39 $ 4.71 14.4%
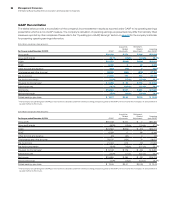
* See page 43 for a more detailed reconciliation of net income to operating earnings.
NM—Not meaningful
Snapshot
In the fourth quarter of 2012, the company improved its year-to-year
revenue growth rate, primarily in higher margin areas, while driving
significant margin expansion and profit growth. The company deliv-
ered diluted earning per share of $5.13, a growth of 11.0 percent, and
$5.39, an increase of 14.4 percent on an operating (non-GAAP)
basis. The company generated $6.3 billion in cash from operations
in the fourth quarter driving shareholder returns of $4.0 billion in
gross common stock repurchases and dividends.
Revenue in the fourth quarter declined 0.6 percent as reported,
but was flat at constant currency. Normalized for the RSS divestiture,
revenue increased 1 point at constant currency in the quarter, a
2 point improvement from the third quarter of 2012 constant cur-
rency growth rate. Consistent with the company’s business model
to move to higher value areas, revenue continued to grow in the
higher margin businesses which contributed to the overall margin
expansion and profit growth in the fourth quarter.
On a geographic basis, revenue performance was led by the
growth markets which increased 6.8 percent as reported and 7 per-
cent at constant currency. The BRIC countries delivered combined
growth of 11.4 percent (14 percent adjusted for currency). In the
fourth quarter, over 30 growth market countries grew constant
currency revenue at a double-digit rate reflecting ongoing broad-
based strength.
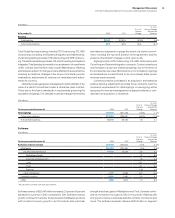
Within the company’s segments, performance was led by con-
tinued momentum in the growth initiatives and successful product
launches in high-end systems—both of which drove a more profit-
able mix. Software revenue increased 3.5 percent (4 percent
adjusted for currency), driven by business analytics, Smarter Com-
merce and cloud with strength in several emerging areas where the
company has been targeting its investments—Social Business,
mobile and security. Systems and Technology revenue declined 0.7
percent (1 percent adjusted for currency); adjusted for the RSS
divestiture, revenue increased 3.6 percent (4 percent adjusted for
currency) versus the prior year. New product introductions per-
formed well in the quarter. System z revenue increased 55.6 percent
(56 percent adjusted for currency) reflecting strong acceptance of
the new mainframe. System z revenue increased over 50 percent
in the major markets and over 65 percent in the growth markets.
Global Services revenue decreased 2.1 percent (1 percent adjusted
for currency) with the constant currency growth rate consistent with
the third quarter of 2012. Global Services continued to have strong
performance in all of the key growth initiatives which are becoming
a larger part of the services business.
The consolidated gross profit margin increased 1.8 points versus
the fourth quarter of 2011 to 51.8 percent. The operating (non-GAAP)
gross margin increased 2.1 points to 52.3 percent. The improvement
was driven by a combination of strong mainframe growth, good
margin expansion in both services segments and an improving seg-
ment mix due to the relative strength of software.
Total expense and other income decreased 1.5 percent in the
fourth quarter compared to the prior year. Total operating (non-
GAAP) expense and other income decreased 2.3 percent. The
year-to-year drivers for both categories were approximately:
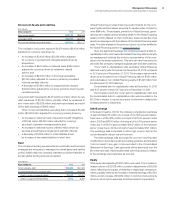
Total Operating
Consolidated (non-GAAP)
• Currency* (1) point (1) point
• Acquisitions** 2 points 2 points
•
Base expense (3) points (3) points
* Reflects impacts of translation and hedging programs.
** Includes acquisitions completed in prior 12-month period.
Pre-tax income grew 7.7 percent and the pre-tax margin was 26.7
percent, an increase of 2.1 points versus the fourth quarter of
2011. Net income increased 6.3 percent and the net income
margin increased 1.3 points to 19.9 percent. The effective tax rate
for the fourth quarter was 25.5 percent, an increase of 1 point
versus the prior year. Operating (non-GAAP) pre-tax income grew
9.5 percent and the operating (non-GAAP) pre-tax margin was
27.7 percent, an increase of 2.6 points versus the prior year. Oper-
ating (non-GAAP) net income increased 9.5 percent and the
operating (non-GAAP) net income margin was 20.9 percent, an