IBM 2012 Annual Report Download - page 107
Download and view the complete annual report
Please find page 107 of the 2012 IBM annual report below. You can navigate through the pages in the report by either clicking on the pages listed below, or by using the keyword search tool below to find specific information within the annual report.-
 1
1 -
2
-
3
-
4
-
5
-
6
-
7
-
8
-
9
-
10
-
11
-
12
-
13
-
14
-
15
-
16
-
17
-
18
-
19
-
20
-
21
-
22
-
23
-
24
-
25
-
26
-
27
-
28
-
29
-
30
-
31
-
32
-
33
-
34
-
35
-
36
-
37
-
38
-
39
-
40
-
41
-
42
-
43
-
44
-
45
-
46
-
47
-
48
-
49
-
50
-
51
-
52
-
53
-
54
-
55
-
56
-
57
-
58
-
59
-
60
-
61
-
62
-
63
-
64
-
65
-
66
-
67
-
68
-
69
-
70
-
71
-
72
-
73
-
74
-
75
-
76
-
77
-
78
-
79
-
80
-
81
-
82
-
83
-
84
-
85
-
86
-
87
-
88
-
89
-
90
-
91
-
92
-
93
-
94
-
95
-
96
-
 97
97 -
 98
98 -
 99
99 -
 100
100 -
 101
101 -
 102
102 -
 103
103 -
 104
104 -
 105
105 -
 106
106 -
 107
107 -
 108
108 -
 109
109 -
 110
110 -
 111
111 -
 112
112 -
 113
113 -
 114
114 -
 115
115 -
 116
116 -
 117
117 -
118
-
119
-
120
-
121
-
122
-
123
-
124
-
125
-
126
-
127
-
128
-
129
-
130
-
131
-
132
-
133
-
134
-
135
-
136
-
137
-
138
-
139
-
140
-
141
-
142
-
143
-
144
-
145
-
146
 |
 |

106 Notes to Consolidated Financial Statements
International Business Machines Corporation and Subsidiary Companies
106
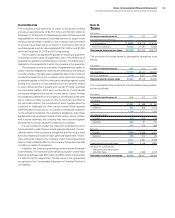
Note K.
Other Liabilities
($ in millions)
At December 31: 2012 2011
Income tax reserves $2,527 $3,989
Executive compensation accruals 1,542 1,388
Disability benefits 890 835
Derivative liabilities 78 166
Special actions 430 347
Workforce reductions 473 366
Deferred taxes 448 549
Environmental accruals 216 249
Noncurrent warranty accruals 167 163
Asset retirement obligations 127 166
Other 709 777
To t a l $7,607 $8,996
In response to changing business needs, the company periodically
takes workforce reduction actions to improve productivity, cost
competitiveness and to rebalance skills. The noncurrent contractually
obligated future payments associated with these activities are
reflected in the workforce reductions caption in the previous table.
In addition, the company executed certain special actions
as follows: (1) the second quarter of 2005 associated with Global
Services, primarily in Europe, (2) the fourth quarter of 2002 associ-
ated with the acquisition of the PricewaterhouseCoopers consulting
business, (3) the second quarter of 2002 associated with the
Microelectronics Division and the rebalancing of the company’s
workforce and leased space resources, (4) the 2002 actions associ-
ated with the hard disk drive business for reductions in workforce,
manufacturing capacity and space, (5) the actions taken in 1999,
and (6) the actions that were executed prior to 1994.
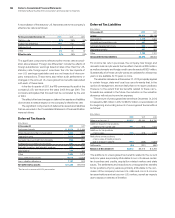
The table below provides a roll forward of the current and noncurrent liabilities associated with these special actions. The current liabilities
presented in the table are included in other accrued expenses and liabilities in the Consolidated Statement of Financial Position.
(in millions)
Liability
as of
January 1,
2012 Payments
Other
Adjustments*
Liability
as of
December 31,
2012
Current
Workforce $ 33 $(32) $27 $ 28
Space 4 (4) 1 2
Total current $ 38 $(36) $28 $ 30
Noncurrent
Workforce $344 $ — $85 $430
Space 3 — (3) 0
Total noncurrent $347 $ — $83 $430
*
The other adjustments column in the table above principally includes the reclassification of noncurrent to current, remeasurement of actuarial assumptions, foreign currency
translation adjustments and interest accretion.
The workforce accruals primarily relate to terminated employees
who are no longer working for the company who were granted
annual payments to supplement their incomes in certain countries.
Depending on the individual country’s legal requirements, these
required payments will continue until the former employee begins
receiving pension benefits or passes away. The space accruals are
for ongoing obligations to pay rent for vacant space that could not
be sublet or space that was sublet at rates lower than the committed
lease arrangement. The length of these obligations varies by lease
with the longest extending through 2014.
The company employs extensive internal environmental protec-
tion programs that primarily are preventive in nature. The company
also participates in environmental assessments and cleanups at a
number of locations, including operating facilities, previously owned
facilities and Superfund sites. The company’s maximum exposure
for all environmental liabilities cannot be estimated and no amounts
have been recorded for non-ARO environmental liabilities that are
not probable or estimable. The total amounts accrued for non-ARO
environmental liabilities, including amounts classified as current in
the Consolidated Statement of Financial Position, that do not reflect
actual or anticipated insurance recoveries, were $229 million and
$262 million at December 31, 2012 and 2011, respectively. Estimated
environmental costs are not expected to materially affect the con-
solidated financial position or consolidated results of the company’s
operations in future periods. However, estimates of future costs are
subject to change due to protracted cleanup periods and changing
environmental remediation regulations.
As of December 31, 2012, the company was unable to estimate the
range of settlement dates and the related probabilities for certain
asbestos remediation AROs. These conditional AROs are primarily
related to the encapsulated structural fireproofing that is not subject to
abatement unless the buildings are demolished and non-encapsulated
asbestos that the company would remediate only if it performed major
renovations of certain existing buildings. Because these conditional