IBM 2012 Annual Report Download - page 65
Download and view the complete annual report
Please find page 65 of the 2012 IBM annual report below. You can navigate through the pages in the report by either clicking on the pages listed below, or by using the keyword search tool below to find specific information within the annual report.-
 1
1 -
2
-
3
-
4
-
5
-
6
-
7
-
8
-
9
-
10
-
11
-
12
-
13
-
14
-
15
-
16
-
17
-
18
-
19
-
20
-
21
-
22
-
23
-
24
-
25
-
26
-
27
-
28
-
29
-
30
-
31
-
32
-
33
-
34
-
35
-
36
-
37
-
38
-
39
-
40
-
41
-
42
-
43
-
44
-
45
-
46
-
47
-
48
-
49
-
50
-
51
-
52
-
53
-
54
-
 55
55 -
 56
56 -
 57
57 -
 58
58 -
 59
59 -
 60
60 -
 61
61 -
 62
62 -
 63
63 -
 64
64 -
 65
65 -
 66
66 -
 67
67 -
 68
68 -
 69
69 -
 70
70 -
 71
71 -
 72
72 -
 73
73 -
 74
74 -
 75
75 -
76
-
77
-
78
-
79
-
80
-
81
-
82
-
83
-
84
-
85
-
86
-
87
-
88
-
89
-
90
-
91
-
92
-
93
-
94
-
95
-
96
-
97
-
98
-
99
-
100
-
101
-
102
-
103
-
104
-
105
-
106
-
107
-
108
-
109
-
110
-
111
-
112
-
113
-
114
-
115
-
116
-
117
-
118
-
119
-
120
-
121
-
122
-
123
-
124
-
125
-
126
-
127
-
128
-
129
-
130
-
131
-
132
-
133
-
134
-
135
-
136
-
137
-
138
-
139
-
140
-
141
-
142
-
143
-
144
-
145
-
146
 |
 |

6464 Management Discussion
International Business Machines Corporation and Subsidiary Companies
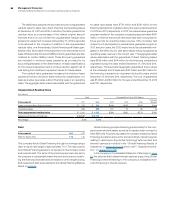
Total revenue in 2011 increased $115 million versus 2010 as a result of:
• An increase in internal revenue of 13.6 percent primarily
driven by an increase in used equipment sales revenue
(up 19.7 percent to $1,528 million); partially offset by
• A decline in external revenue of 6.1 percent (9 percent
adjusted for currency) driven by a decrease in used equipment
sales revenue (down 25.5 percent to $490 million), partially
offset by an increase in financing revenue (up 2.0 percent to
$1,612 million).
The increase in external financing revenue was due to a higher aver-
age asset balance and an increase in remarketing lease revenue.
Global Financing gross profit in 2011 increased 4.7 percent com-
pared to 2010 due to higher used equipment sales and financing
gross profit. The gross profit margin increased 1.2 points primarily
due to a higher used equipment sales margin.
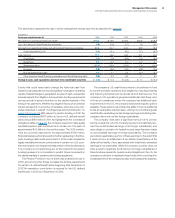
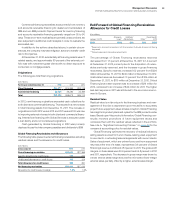
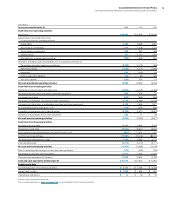
Global Financing pre-tax income increased 1.1 percent in 2012
versus 2011, following an increase of 2.8 percent in 2011 versus 2010.
The increase in 2012 was driven by decreases in SG&A expense
($61 million) and financing receivables provisions ($16 million),
partially offset by the decrease in gross profit ($55 million). The
increase in 2011 was driven by the increase in gross profit ($122
million), partially offset by increases in financing receivables provi-
sions ($51 million) and SG&A expense ($13 million). The increase in
financing receivables provisions in 2011 was due primarily to the
economic environment in Europe. At December 31, 2012, the overall
allowance for credit losses coverage rate was 1.2 percent, a decrease
of 0.1 points versus 2011.
The increase in return on equity from 2011 to 2012 was driven by
higher after-tax income, and the decrease in return on equity from
2010 to 2011 was driven by a higher average equity balance.
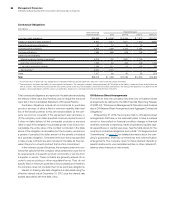
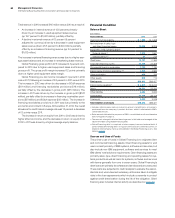
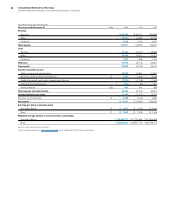
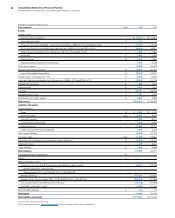
Financial Condition
Balance Sheet
($ in millions)
At December 31: 2012 2011
Cash and cash equivalents $ 1,380 $ 1,308
Net investment in sales-type
and direct financing leases 10,008 9,209
Equipment under operating leases
External clients (a) 1,273 1,567
Internal clients (b)(c) 25 219
Client loans 13,121 11,363
Total client financing assets 24,428 22,358
Commercial financing receivables 7,755 7,130
Intercompany financing receivables (b)(c) 4,328 4,586
Other receivables 459 334
Other assets 533 712
Total assets $38,882 $36,427
Intercompany payables
(b) $ 6,802 $ 6,213
Debt (d) 24,501 23,332
Other liabilities 4,084 3,633
Total liabilities 35,388 33,178
Total equity 3,494 3,249
Total liabilities and equity $38,882 $36,427
(a) Includes intercompany mark-up, priced on an arm’s-length basis, on products
purchased from the company’s product divisions, which is eliminated in IBM’s
consolidated results.
(b) Entire amount eliminated for purposes of IBM’s consolidated results and therefore
does not appear on page 72.
(c) These assets, along with all other financing assets in this table, are leveraged at the
value in the table using Global Financing debt.
(d) Global Financing debt is comprised of intercompany loans and external debt. A
portion of Global Financing debt is in support of the company’s internal business, or
related to intercompany mark-up embedded in the Global Financing assets. See
table on page 67.
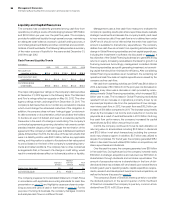
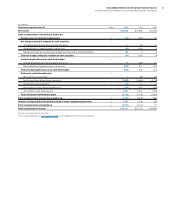
Sources and Uses of Funds
The primary use of funds in Global Financing is to originate client
and commercial financing assets. Client financing assets for end
users consist primarily of IBM systems, software and services, but
also include non-IBM equipment, software and services to meet
IBM clients’ total solutions requirements. Client financing assets are
primarily sales-type, direct financing and operating leases for sys-
tems products as well as loans for systems, software and services
with terms generally from one to seven years. Global Financing’s
client loans are primarily for software and services and are unsecured.
These loans are subjected to credit analysis to evaluate the associ-
ated risk and, when deemed necessary, actions are taken to mitigate
risks in the loan agreements which include covenants to protect
against credit deterioration during the life of the obligation. Client
financing also includes internal activity as described on page 24.