IBM 2012 Annual Report Download - page 104
Download and view the complete annual report
Please find page 104 of the 2012 IBM annual report below. You can navigate through the pages in the report by either clicking on the pages listed below, or by using the keyword search tool below to find specific information within the annual report.-
 1
1 -
2
-
3
-
4
-
5
-
6
-
7
-
8
-
9
-
10
-
11
-
12
-
13
-
14
-
15
-
16
-
17
-
18
-
19
-
20
-
21
-
22
-
23
-
24
-
25
-
26
-
27
-
28
-
29
-
30
-
31
-
32
-
33
-
34
-
35
-
36
-
37
-
38
-
39
-
40
-
41
-
42
-
43
-
44
-
45
-
46
-
47
-
48
-
49
-
50
-
51
-
52
-
53
-
54
-
55
-
56
-
57
-
58
-
59
-
60
-
61
-
62
-
63
-
64
-
65
-
66
-
67
-
68
-
69
-
70
-
71
-
72
-
73
-
74
-
75
-
76
-
77
-
78
-
79
-
80
-
81
-
82
-
83
-
84
-
85
-
86
-
87
-
88
-
89
-
90
-
91
-
92
-
93
-
 94
94 -
 95
95 -
 96
96 -
 97
97 -
 98
98 -
 99
99 -
 100
100 -
 101
101 -
 102
102 -
 103
103 -
 104
104 -
 105
105 -
 106
106 -
 107
107 -
 108
108 -
 109
109 -
 110
110 -
 111
111 -
 112
112 -
 113
113 -
 114
114 -
115
-
116
-
117
-
118
-
119
-
120
-
121
-
122
-
123
-
124
-
125
-
126
-
127
-
128
-
129
-
130
-
131
-
132
-
133
-
134
-
135
-
136
-
137
-
138
-
139
-
140
-
141
-
142
-
143
-
144
-
145
-
146
 |
 |

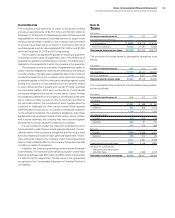
Notes to Consolidated Financial Statements
International Business Machines Corporation and Subsidiary Companies
103
($ in millions)
At December 31, 2011:
Gross
Carrying
Amount
Accumulated
Amortization
Net
Carrying
Amount
Intangible asset class
Capitalized software $1,478 $ (678) $ 799
Client relationships 1,751 (715) 1,035
Completed technology 2,160 (746) 1,414
In-process R&D 18 — 18
Patents/trademarks 207 (88) 119
Other* 29 (22) 7
To t a l $5,642 $(2,250) $3,392
* Other intangibles are primarily acquired proprietary and nonproprietary business
processes, methodologies and systems.
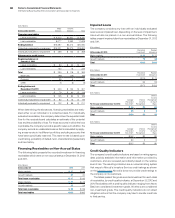
The net carrying amount of intangible assets increased $395 million
during the year ended December 31, 2012, primarily due to intangible
asset additions resulting from acquisitions, partially offset by amor-
tization. There was no impairment of intangible assets recorded in
2012 and 2011.
Total amortization was $1,284 million and $1,226 million for the
years ended December 31, 2012 and 2011, respectively. The aggre-
gate amortization expense for acquired intangibles assets (excluding
capitalized software) was $709 million and $634 million for the years
ended December 31, 2012 and 2011, respectively. In addition, in 2012
the company retired $641 million of fully amortized intangible assets,
impacting both the gross carrying amount and accumulated amor-
tization by this amount.
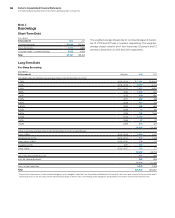
The amortization expense for each of the five succeeding years
relating to intangible assets currently recorded in the Consolidated
Statement of Financial Position is estimated to be the following at
December 31, 2012:
($ in millions)
Capitalized
Software
Acquired
Intangibles Tot a l
2013 $501 $729 $1,230
2014 277 626 903
2015 83 498 581
2016 — 458 458
2017 — 340 340
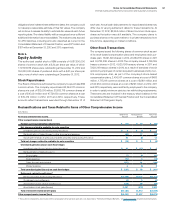
Goodwill
The changes in the goodwill balances by reportable segment, for the years ended December 31, 2012 and 2011, are as follows:
($ in millions)
Segment
Balance
January 1,
2012
Goodwill
Additions
Purchase
Price
Adjustments Divestitures
Foreign
Currency
Translation
and Other
Adjustments
Balance
December 31,
2012
Global Business Services $ 4,313 $ 5 $ (0) $ (2) $ 42 $ 4,357
Global Technology Services 2,646 264 — (0) 6 2,916
Software 18,121 2,182 (30) (6) 137 20,405
Systems and Technology 1,133 443 (0) (14) 6 1,568
To t a l $26,213 $2,894 $(30) $(22) $192 $29,247
($ in millions)
Segment
Balance
January 1,
2011
Goodwill
Additions
Purchase
Price
Adjustments Divestitures
Foreign
Currency
Translation
and Other
Adjustments
Balance
December 31,
2011
Global Business Services $ 4,329 $ 14 $ (0) $(10) $ (20) $ 4,313
Global Technology Services 2,704 — (1) (2) (55) 2,646
Software 16,963 1,277 10 (2) (127) 18,121
Systems and Technology 1,139 — (6) — (0) 1,133
To t a l $25,136 $1,291 $ 2 $(13) $(203 ) $26,213
Purchase price adjustments recorded in 2012 and 2011 were related to acquisitions that were completed on or prior to December 31, 2011
or December 31, 2010, respectively, and were still subject to the measurement period that ends at the earlier of 12 months from the acquisition
date or when information becomes available. There were no goodwill impairment losses recorded in 2012 or 2011, and the company has no
accumulated goodwill impairment losses.