IBM 2012 Annual Report Download - page 10
Download and view the complete annual report
Please find page 10 of the 2012 IBM annual report below. You can navigate through the pages in the report by either clicking on the pages listed below, or by using the keyword search tool below to find specific information within the annual report.-
 1
1 -
 2
2 -
 3
3 -
 4
4 -
 5
5 -
 6
6 -
 7
7 -
 8
8 -
 9
9 -
 10
10 -
 11
11 -
 12
12 -
 13
13 -
 14
14 -
 15
15 -
 16
16 -
 17
17 -
 18
18 -
 19
19 -
 20
20 -
 21
21 -
22
-
23
-
24
-
25
-
26
-
27
-
28
-
29
-
30
-
31
-
32
-
33
-
34
-
35
-
36
-
37
-
38
-
39
-
40
-
41
-
42
-
43
-
44
-
45
-
46
-
47
-
48
-
49
-
50
-
51
-
52
-
53
-
54
-
55
-
56
-
57
-
58
-
59
-
60
-
61
-
62
-
63
-
64
-
65
-
66
-
67
-
68
-
69
-
70
-
71
-
72
-
73
-
74
-
75
-
76
-
77
-
78
-
79
-
80
-
81
-
82
-
83
-
84
-
85
-
86
-
87
-
88
-
89
-
90
-
91
-
92
-
93
-
94
-
95
-
96
-
97
-
98
-
99
-
100
-
101
-
102
-
103
-
104
-
105
-
106
-
107
-
108
-
109
-
110
-
111
-
112
-
113
-
114
-
115
-
116
-
117
-
118
-
119
-
120
-
121
-
122
-
123
-
124
-
125
-
126
-
127
-
128
-
129
-
130
-
131
-
132
-
133
-
134
-
135
-
136
-
137
-
138
-
139
-
140
-
141
-
142
-
143
-
144
-
145
-
146
 |
 |

IBM operations in more than 170 countries leverage the company’s
global scale and expertise.
A globally integrated model allows us to focus resources
on client-oriented work and enables rapid deployment of IBM
capabilities to growth markets. In 2012, we continued our rapid
geographic expansion—opening 144 branch offices. Our growth
markets delivered more than 60 percent of our geographic
gross profit growth between 2010 and 2012.
Global integration of all our major enterprise functions—from
service delivery to marketing—has enabled IBM to deliver enterprise
productivity savings while improving quality.
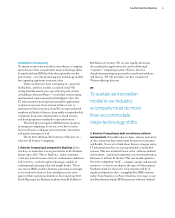
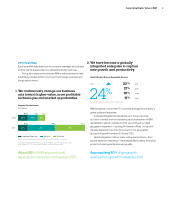
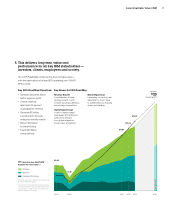
2. We have become a globally
integrated enterprise to capture
new growth and productivity.
Approaching 30% of geographic
revenue from growth markets by 2015.
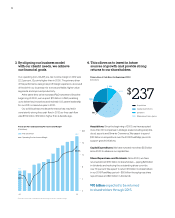
1. We continuously change our business
mix toward higher-value, more profitable
technologies and market opportunities.
Segment Pre-tax Income*
($ in billions)
About 50% of IBM segment profit
expected to come from Software by 2015.
* Sum of external segment pre-tax income not equal to IBM pre-tax income.
** Excludes Enterprise Investments and not restated for stock-based compensation.
2000 Segment PTI is reclassified to conform with 2012 presentation.
Hardware/Financing Services Software
2000**
3.3 3.7 2.6
35% 38% 27%
3.3 9.9 10.8
14% 41% 45%
2012
Growth Markets Share of Geographic Revenue
24%
2011
2010
2009
2000*
2012
* Excluding divested businesses of PCs and printers.
2015 Road Map
Each year IBM describes how the company manages its business
and serves its shareholders in a detailed financial road map.
A long-term perspective ensures IBM is well positioned to take
advantage of major shifts occurring in technology, business and
the global economy.
22
%
21
%
19
%
11
%
9
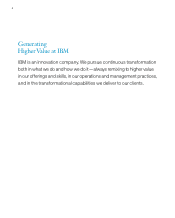
Generating Higher Value at IBM