IBM 2012 Annual Report Download - page 105
Download and view the complete annual report
Please find page 105 of the 2012 IBM annual report below. You can navigate through the pages in the report by either clicking on the pages listed below, or by using the keyword search tool below to find specific information within the annual report.-
 1
1 -
2
-
3
-
4
-
5
-
6
-
7
-
8
-
9
-
10
-
11
-
12
-
13
-
14
-
15
-
16
-
17
-
18
-
19
-
20
-
21
-
22
-
23
-
24
-
25
-
26
-
27
-
28
-
29
-
30
-
31
-
32
-
33
-
34
-
35
-
36
-
37
-
38
-
39
-
40
-
41
-
42
-
43
-
44
-
45
-
46
-
47
-
48
-
49
-
50
-
51
-
52
-
53
-
54
-
55
-
56
-
57
-
58
-
59
-
60
-
61
-
62
-
63
-
64
-
65
-
66
-
67
-
68
-
69
-
70
-
71
-
72
-
73
-
74
-
75
-
76
-
77
-
78
-
79
-
80
-
81
-
82
-
83
-
84
-
85
-
86
-
87
-
88
-
89
-
90
-
91
-
92
-
93
-
94
-
 95
95 -
 96
96 -
 97
97 -
 98
98 -
 99
99 -
 100
100 -
 101
101 -
 102
102 -
 103
103 -
 104
104 -
 105
105 -
 106
106 -
 107
107 -
 108
108 -
 109
109 -
 110
110 -
 111
111 -
 112
112 -
 113
113 -
 114
114 -
 115
115 -
116
-
117
-
118
-
119
-
120
-
121
-
122
-
123
-
124
-
125
-
126
-
127
-
128
-
129
-
130
-
131
-
132
-
133
-
134
-
135
-
136
-
137
-
138
-
139
-
140
-
141
-
142
-
143
-
144
-
145
-
146
 |
 |

104 Notes to Consolidated Financial Statements
International Business Machines Corporation and Subsidiary Companies
104
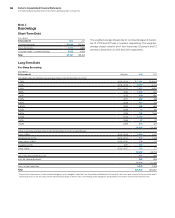
Long-Term Debt
Pre-Swap Borrowing
($ in millions)
At December 31: Maturities 2012 2011
U.S. dollar notes and debentures (average interest rate at December 31, 2012):
2.79% 2013 – 2014 $ 7,131 $ 8,615
1.46% 2015 – 2016 5,807 2,414
5.29% 2017 –2021 7,457 8,600
1.88% 2022 1,000 500
7.00% 2025 600 600
6.22% 2027 469 469
6.50% 2028 313 313
5.875% 2032 600 600
8.00% 2038 83 187
5.60% 2039 745 1,545
4.00% 2042 1,107 —
7.00% 2045 27 27
7.125% 2096 316 322
25,656 24,192
Other currencies (average interest rate at December 31, 2012, in parentheses):
Euros (3.6%) 2013 – 2019 2,338 1,037
Japanese yen (0.7%) 2013 – 2014 878 1,123
Swiss francs (3.8%) 2015 – 2020 178 173
Canadian (2.2%) 2017 502 —
Other (4.6%) 2013 – 2017 107 177
29,660 26,702
Less: net unamortized discount 865 533
Add: fair value adjustment* 886 994
29,680 27,161
Less: current maturities 5,593 4,306
To t a l $24,088 $22,857
* The portion of the company’s fixed-rate debt obligations that is hedged is reflected in the Consolidated Statement of Financial Position as an amount equal to the sum of the debt’s
carrying value plus a fair value adjustment representing changes in the fair value of the hedged debt obligations attributable to movements in benchmark interest rates.
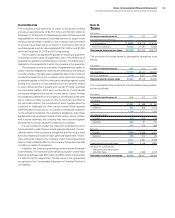
Note J.
Borrowings
Short-Term Debt
($ in millions)
At December 31: 2012 2011
Commercial paper $1,800 $2,300
Short-term loans 1,789 1,859
Long-term debt—current maturities 5,593 4,306
To t a l $9,181 $8,463
The weighted-average interest rate for commercial paper at Decem-
ber 31, 2012 and 2011 was 0.1 percent, respectively. The weighted-
average interest rates for short-term loans was 1.8 percent and 1.2
percent at December 31, 2012 and 2011, respectively.