IBM 2012 Annual Report Download - page 119
Download and view the complete annual report
Please find page 119 of the 2012 IBM annual report below. You can navigate through the pages in the report by either clicking on the pages listed below, or by using the keyword search tool below to find specific information within the annual report.-
 1
1 -
2
-
3
-
4
-
5
-
6
-
7
-
8
-
9
-
10
-
11
-
12
-
13
-
14
-
15
-
16
-
17
-
18
-
19
-
20
-
21
-
22
-
23
-
24
-
25
-
26
-
27
-
28
-
29
-
30
-
31
-
32
-
33
-
34
-
35
-
36
-
37
-
38
-
39
-
40
-
41
-
42
-
43
-
44
-
45
-
46
-
47
-
48
-
49
-
50
-
51
-
52
-
53
-
54
-
55
-
56
-
57
-
58
-
59
-
60
-
61
-
62
-
63
-
64
-
65
-
66
-
67
-
68
-
69
-
70
-
71
-
72
-
73
-
74
-
75
-
76
-
77
-
78
-
79
-
80
-
81
-
82
-
83
-
84
-
85
-
86
-
87
-
88
-
89
-
90
-
91
-
92
-
93
-
94
-
95
-
96
-
97
-
98
-
99
-
100
-
101
-
102
-
103
-
104
-
105
-
106
-
107
-
108
-
 109
109 -
 110
110 -
 111
111 -
 112
112 -
 113
113 -
 114
114 -
 115
115 -
 116
116 -
 117
117 -
 118
118 -
 119
119 -
 120
120 -
 121
121 -
 122
122 -
 123
123 -
 124
124 -
 125
125 -
 126
126 -
 127
127 -
 128
128 -
 129
129 -
130
-
131
-
132
-
133
-
134
-
135
-
136
-
137
-
138
-
139
-
140
-
141
-
142
-
143
-
144
-
145
-
146
 |
 |

118 Notes to Consolidated Financial Statements
International Business Machines Corporation and Subsidiary Companies
118
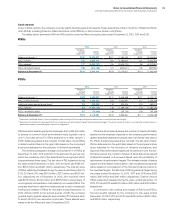
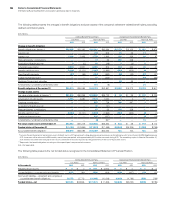
The following table summarizes option activity under the Plans during the years ended December 31, 2012, 2011 and 2010.
2012 2011 2010
Weighted-
Average
Exercise Price
Number of
Shares
Under Option
Weighted-
Average
Exercise Price
Number of
Shares
Under Option
Weighted-
Average
Exercise Price
Number of
Shares
Under Option
Balance at January 1 $ 90 20,662,322 $ 94 39,197,728 $ 98 73,210,457
Options exercised 86 (9,080,170) 98 (18,144,309)101 (33,078,316)
Options canceled/expired 75 (192,431) 107 (391,097)108 (934,413)
Balance at December 31 $ 94 11,389,721 $ 90 20,662,322 $ 94 39,197,728
Exercisable at December 31 $ 94 11,389,721 $ 90 20,662,322 $ 94 39,197,728
The shares under option at December 31, 2012 were in the following exercise price ranges:
Options Outstanding and Exercisable
Exercise Price Range
Weighted-
Average
Exercise Price
Number of
Shares
Under Option
Aggregate
Intrinsic
Value
Weighted-Average
Remaining
Contractual Life
(in Years)
$85 and under $ 83 3,222,177 $ 350,989,003 0.9
$86 – $105 97 7,532,868 709,980,689 1.9
$106 and over 106 634,676 54,314,359 1.1
$ 94 11,389,721 $1,115,284,051 1.6
In connection with various acquisition transactions, there was an
additional 0.9 million stock-based awards, consisting of stock
options and restricted stock units, outstanding at December 31,
2012, as a result of the company’s assumption of stock-based
awards previously granted by the acquired entities. The weighted-
average exercise price of these awards was $68 per share.
Exercises of Employee Stock Options
The total intrinsic value of options exercised during the years ended
December 31, 2012, 2011 and 2010 was $1,005 million, $1,269 million
and $1,072 million, respectively. The total cash received from
employees as a result of employee stock option exercises for the
years ended December 31, 2012, 2011 and 2010 was approximately
$785 million, $1,786 million and $3,347 million, respectively. In con-
nection with these exercises, the tax benefits realized by the
company for the years ended December 31, 2012, 2011 and 2010
were $341 million, $412 million and $351 million, respectively.
The company settles employee stock option exercises primarily
with newly issued common shares and, occasionally, with treasury
shares. Total treasury shares held at December 31, 2012 and 2011 were
approximately 1,080 million and 1,019 million shares, respectively.