IBM 2012 Annual Report Download - page 30
Download and view the complete annual report
Please find page 30 of the 2012 IBM annual report below. You can navigate through the pages in the report by either clicking on the pages listed below, or by using the keyword search tool below to find specific information within the annual report.-
 1
1 -
2
-
3
-
4
-
5
-
6
-
7
-
8
-
9
-
10
-
11
-
12
-
13
-
14
-
15
-
16
-
17
-
18
-
19
-
 20
20 -
 21
21 -
 22
22 -
 23
23 -
 24
24 -
 25
25 -
 26
26 -
 27
27 -
 28
28 -
 29
29 -
 30
30 -
 31
31 -
 32
32 -
 33
33 -
 34
34 -
 35
35 -
 36
36 -
 37
37 -
 38
38 -
 39
39 -
 40
40 -
41
-
42
-
43
-
44
-
45
-
46
-
47
-
48
-
49
-
50
-
51
-
52
-
53
-
54
-
55
-
56
-
57
-
58
-
59
-
60
-
61
-
62
-
63
-
64
-
65
-
66
-
67
-
68
-
69
-
70
-
71
-
72
-
73
-
74
-
75
-
76
-
77
-
78
-
79
-
80
-
81
-
82
-
83
-
84
-
85
-
86
-
87
-
88
-
89
-
90
-
91
-
92
-
93
-
94
-
95
-
96
-
97
-
98
-
99
-
100
-
101
-
102
-
103
-
104
-
105
-
106
-
107
-
108
-
109
-
110
-
111
-
112
-
113
-
114
-
115
-
116
-
117
-
118
-
119
-
120
-
121
-
122
-
123
-
124
-
125
-
126
-
127
-
128
-
129
-
130
-
131
-
132
-
133
-
134
-
135
-
136
-
137
-
138
-
139
-
140
-
141
-
142
-
143
-
144
-
145
-
146
 |
 |

29
Management Discussion
International Business Machines Corporation and Subsidiary Companies
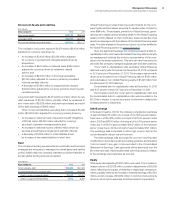
Total Global Services backlog includes GTS Outsourcing, ITS, GBS
Outsourcing, Consulting and Systems Integration and Maintenance.
Outsourcing backlog includes GTS Outsourcing and GBS Outsourc-
ing. Transactional backlog includes ITS and Consulting and Systems
Integration.Total backlog is intended to be a statement of overall work
under contract and therefore does include Maintenance. Backlog
estimates are subject to change and are affected by several factors,
including terminations, changes in the scope of contracts, periodic
revalidations, adjustments for revenue not materialized and adjust-
ments for currency.
Global Services signings are management’s initial estimate of the
value of a client’s commitment under a Global Services contract.
There are no third-party standards or requirements governing the
calculation of signings. The calculation used by management involves
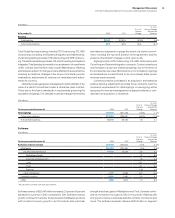
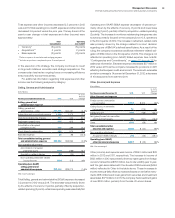
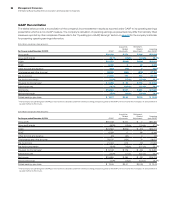
Software revenue of $25,448 million increased 2.0 percent (4 percent
adjusted for currency) in 2012 compared to 2011. Software revenue
growth continued to be led by the key branded middleware products
with constant currency growth in all the brands, and particular
strength and share gains in WebSphere and Tivoli. Software contin-
ued its momentum throughout 2012 in the growth initiatives with
strong performance in business analytics, Smarter Commerce and
cloud. The Software business delivered $10.8 billion in segment
estimates and judgments to gauge the extent of a client’s commit-
ment, including the type and duration of the agreement, and the
presence of termination charges or wind-down costs.
Signings include GTS Outsourcing, ITS, GBS Outsourcing and
Consulting and Systems Integration contracts. Contract extensions
and increases in scope are treated as signings only to the extent of
the incremental new value. Maintenance is not included in signings
as maintenance contracts tend to be more steady state, where
revenues equal renewals.
Contract portfolios purchased in an acquisition are treated as
positive backlog adjustments provided those contracts meet the
company’s requirements for initial signings. A new signing will be
recognized if a new services agreement is signed incidental or coin-
cidental to an acquisition or divestiture.
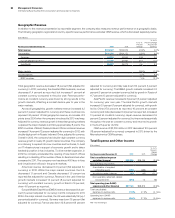
($ in millions)
For the year ended December 31: 2012 2011
Yr.-to-Yr.
Percent
Change
Yr.-to-Yr.
Percent Change
Adjusted for
Currency
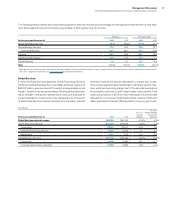
Total signings $56,595 $57,435 (1.5)% 1.1%
Outsourcing signings $27,891 $29,251 (4.6)% (1.9)%
Transactional signings 28,703 28,184 1.8 4.1
Software
($ in millions)
For the year ended December 31: 2012 2011*
Yr.-to-Yr.
Percent
Change
Yr.-to-Yr.
Percent Change
Adjusted for
Currency
Software external revenue $25,448 $24,944 2.0%4.3%
Middleware $20,983 $20,650 1.6%3.9%
Key Branded Middleware 16,528 16,055 2.9 5.2
WebSphere Family 7.8 9.9
Information Management 1.5 3.8
Lotus (2.1)0.3
Tivoli 4.1 6.2
Rational (1.6)0.6
Other middleware 4,455 4,596 (3.1)(0.6)
Operating systems 2,525 2,480 1.8 4.3
Other 1,940 1,813 7.0 9.2
* Reclassified to conform with 2012 presentation.
($ in billions)
At December 31: 2012 2011
Yr.-to-Yr.
Percent
Change
Yr.-to-Yr.
Percent Change
Adjusted for
Currency
Backlog
Total backlog $140.3 $140.6 (0.3)% 0.6%
Outsourcing backlog 89.4 92.5 (3.3) (2.4)