IBM 2012 Annual Report Download - page 27
Download and view the complete annual report
Please find page 27 of the 2012 IBM annual report below. You can navigate through the pages in the report by either clicking on the pages listed below, or by using the keyword search tool below to find specific information within the annual report.-
 1
1 -
2
-
3
-
4
-
5
-
6
-
7
-
8
-
9
-
10
-
11
-
12
-
13
-
14
-
15
-
16
-
 17
17 -
 18
18 -
 19
19 -
 20
20 -
 21
21 -
 22
22 -
 23
23 -
 24
24 -
 25
25 -
 26
26 -
 27
27 -
 28
28 -
 29
29 -
 30
30 -
 31
31 -
 32
32 -
 33
33 -
 34
34 -
 35
35 -
 36
36 -
 37
37 -
38
-
39
-
40
-
41
-
42
-
43
-
44
-
45
-
46
-
47
-
48
-
49
-
50
-
51
-
52
-
53
-
54
-
55
-
56
-
57
-
58
-
59
-
60
-
61
-
62
-
63
-
64
-
65
-
66
-
67
-
68
-
69
-
70
-
71
-
72
-
73
-
74
-
75
-
76
-
77
-
78
-
79
-
80
-
81
-
82
-
83
-
84
-
85
-
86
-
87
-
88
-
89
-
90
-
91
-
92
-
93
-
94
-
95
-
96
-
97
-
98
-
99
-
100
-
101
-
102
-
103
-
104
-
105
-
106
-
107
-
108
-
109
-
110
-
111
-
112
-
113
-
114
-
115
-
116
-
117
-
118
-
119
-
120
-
121
-
122
-
123
-
124
-
125
-
126
-
127
-
128
-
129
-
130
-
131
-
132
-
133
-
134
-
135
-
136
-
137
-
138
-
139
-
140
-
141
-
142
-
143
-
144
-
145
-
146
 |
 |

2626 Management Discussion
International Business Machines Corporation and Subsidiary Companies
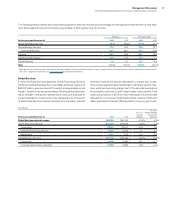
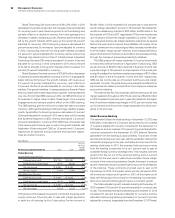
Year in Review
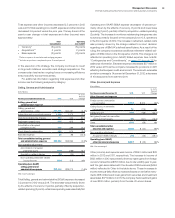
Segment Details
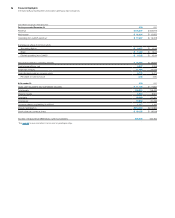
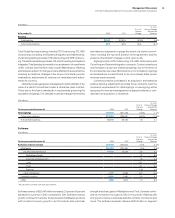
The following is an analysis of the 2012 versus 2011 reportable segment results. The table below presents each reportable segment’s external
revenue and gross margin results.
($ in millions)
For the year ended December 31: 2012 2011
Yr.-to-Yr.
Percent/
Margin
Change
Yr.-to-Yr.
Percent Change
Adjusted for
Currency
Revenue
Global Technology Services $ 40,236 $ 40,879 (1.6)% 1.3%
Gross margin 36.6% 35.0% 1.6 pts.
Global Business Services 18,566 19,284 (3.7)% (1.6)%
Gross margin 30.0% 28.8% 1.2 pts.
Software 25,448 24,944 2.0%4.3%
Gross margin 88.7% 88.5% 0.2 pts.
Systems and Technology 17,667 18,985 (6.9)% (5.9)%
Gross margin 39.1% 39.8% (0.7) pts.
Global Financing 2,013 2,102 (4.2)% (1.2)%
Gross margin 46.5% 49.8% (3.3 ) pts.
Other 577 722 (20.1)% (18.7)%
Gross margin (71.6)% (54.5)% (17.1) pts.
Total consolidated revenue $104,507 $106,916 (2.3)% 0.0%
Total consolidated gross profit $ 50,298 $ 50,138 0.3%
Total consolidated gross margin 48.1% 46.9% 1.2 pts.
Non-operating adjustments
Amortization of acquired intangible assets 375 340 10.3%
Acquisition-related charges 1113.1
Retirement-related costs/(income) 264 2NM
Operating (non-GAAP) gross profit $ 50,938 $ 50,481 0.9%
Operating (non-GAAP) gross margin 48.7% 47.2% 1.5 pts.
NM—Not meaningful
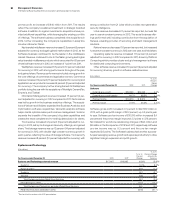
The company has now embarked on the next generation of
its transformation in which new capabilities and technologies like
business analytics and cloud computing will drive performance.
The proven principles of the globally integrated enterprise will
be applied to all of the company’s spending to continue to drive
additional productivity benefits in shared services, end-to-end
process transformation and integrated operations. The company
primarily reinvests the benefits of its enterprise transformation initia-
tives in remixing its spending profile and resources to the higher
growth, higher margin initiatives such as business analytics, Smarter
Planet and cloud computing, in addition to improving profitability.
Integrated Supply Chain
IBM spends approximately $35 billion annually through its supply
chain, procuring materials and services globally. In addition, in 2012,
the company managed approximately $20 billion in procurement
spending for its clients through the Global Process Services orga-
nization. The supply, manufacturing, and logistics and customer
fulfillment operations are integrated in one operating unit that has
optimized inventories over time. Simplifying and streamlining internal
processes has improved sales force productivity and operational
effectiveness and efficiency. Continuous improvements to supply
chain resiliency against marketplace changes and risks have been
particularly valuable in maintaining continuity during natural disasters
and other disruptive events.
The company’s continuing efforts to derive business value from
its own globally integrated supply chain provides a strategic advan-
tage for the company to create value for clients. IBM leverages its
supply chain expertise for clients through its supply chain business
transformation outsourcing service to optimize and help operate
clients’ end-to-end supply chain processes, from procurement to
logistics.
Increasingly the company is using analytics to measure, manage
and fine tune its supply chain operations, which will help to reshape
its operations and create value for clients. The goal is to continue to
increase the use of analytics in the five major areas of supply chain:
1) Supply Chain Visibility, 2) Risk Management, 3) Customer Insight,
4) Cost Containment, and 5) Global Supply Chain and Sustainability.