IBM 2012 Annual Report Download - page 52
Download and view the complete annual report
Please find page 52 of the 2012 IBM annual report below. You can navigate through the pages in the report by either clicking on the pages listed below, or by using the keyword search tool below to find specific information within the annual report.-
 1
1 -
2
-
3
-
4
-
5
-
6
-
7
-
8
-
9
-
10
-
11
-
12
-
13
-
14
-
15
-
16
-
17
-
18
-
19
-
20
-
21
-
22
-
23
-
24
-
25
-
26
-
27
-
28
-
29
-
30
-
31
-
32
-
33
-
34
-
35
-
36
-
37
-
38
-
39
-
40
-
41
-
 42
42 -
 43
43 -
 44
44 -
 45
45 -
 46
46 -
 47
47 -
 48
48 -
 49
49 -
 50
50 -
 51
51 -
 52
52 -
 53
53 -
 54
54 -
 55
55 -
 56
56 -
 57
57 -
 58
58 -
 59
59 -
 60
60 -
 61
61 -
 62
62 -
63
-
64
-
65
-
66
-
67
-
68
-
69
-
70
-
71
-
72
-
73
-
74
-
75
-
76
-
77
-
78
-
79
-
80
-
81
-
82
-
83
-
84
-
85
-
86
-
87
-
88
-
89
-
90
-
91
-
92
-
93
-
94
-
95
-
96
-
97
-
98
-
99
-
100
-
101
-
102
-
103
-
104
-
105
-
106
-
107
-
108
-
109
-
110
-
111
-
112
-
113
-
114
-
115
-
116
-
117
-
118
-
119
-
120
-
121
-
122
-
123
-
124
-
125
-
126
-
127
-
128
-
129
-
130
-
131
-
132
-
133
-
134
-
135
-
136
-
137
-
138
-
139
-
140
-
141
-
142
-
143
-
144
-
145
-
146
 |
 |

51
Management Discussion
International Business Machines Corporation and Subsidiary Companies
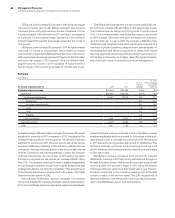
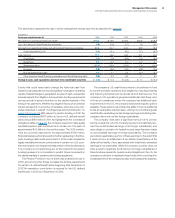
Total Expense and Other Income
($ in millions)
For the year ended December 31: 2011 2010
Yr.-to-Yr.
Percent/
Margin
Change
Total consolidated expense
and other (income) $29,135 $26,291 10.8%
Non-operating adjustments
Amortization of acquired
intangible assets (289) (253) 14.4
Acquisition-related charges (45) (46) (1.8)
Non-operating retirement-related
(costs)/income 74 210 (64.6)
Total operating (non-GAAP)
expense and other (income) $28,875 $26,202 10.2%
Total consolidated
expense-to-revenue ratio 27.3% 26.3%0.9 pts.
Operating (non-GAAP)
expense-to-revenue ratio 27.0%26.2%0.8 pts.
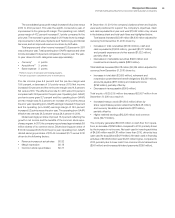
Total expense and other (income) increased 10.8 percent in 2011
versus 2010. Total operating (non-GAAP) expense and other
(income) increased 10.2 percent versus the prior year. The key drivers
of the year-to-year change in total expense and other (income) for
both expense presentations were approximately:
• Currency* 4 points
• Acquisitions** 3 points
• Base expense 3 points
*Reflects impacts of translation and hedging programs.
** Includes acquisitions completed in prior 12-month period.
For additional information regarding total expense and other income,
see the following analyses by category.
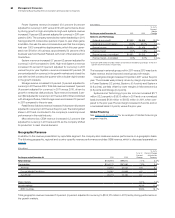
The growth markets increased 16.0 percent (11 percent adjusted
for currency) in 2011 and gained 4 points of market share. The
growth markets strategy to expand into new markets, build out IT
infrastructures and lead in specific industries has driven the strong
performance and share gains. Revenue growth outpaced growth
in the major markets by 10 points in 2011 on a constant currency
basis. In the BRIC countries, revenue increased 18.6 percent (16
percent adjusted for currency) in 2011, with double-digit growth in
each country. Overall in 2011, the company had double-digit constant
currency revenue growth in nearly 40 growth market countries.
These countries contributed nearly two-thirds of the company’s 2011
constant currency revenue growth and represented 22 percent of
total geographic revenue in 2011. To further drive market expansion,
the company opened 92 new branches and added over 1,500 new
sales resources in 2011.
Americas revenue increased 6.9 percent (6 percent adjusted
for currency) in 2011. Within the major market countries, the U.S.
increased 4.2 percent and Canada increased 14.3 percent (10 percent
adjusted for currency). Revenue in the Latin America growth markets
increased 16.9 percent (14 percent adjusted for currency) with
growth in Brazil of 13.0 percent (9 percent adjusted for currency).
EMEA revenue increased 6.5 percent (2 percent adjusted for
currency) in 2011 compared to 2010. In the major market countries,
revenue growth was led by the UK up 9.4 percent (5 percent adjusted
for currency), Spain up 11.2 percent (6 percent adjusted for currency),
Germany up 5.8 percent (1 percent adjusted for currency) and
France up 4.4 percent (flat adjusted for currency). Revenue in Italy
decreased 0.6 percent (5 percent adjusted for currency). The EMEA
growth markets increased 11.6 percent (10 percent adjusted for
currency) in 2011, led by growth in Russia of 49.8 percent (49 percent
adjusted for currency).
Asia Pacific revenue increased 9.2 percent (2 percent adjusted for
currency) year over year. The Asia Pacific growth markets increased
16.8 percent (11 percent adjusted for currency), led by growth in
China of 21.6 percent (18 percent adjusted for currency) and India
of 10.9 percent (13 percent adjusted for currency). Japan revenue
increased 2.0 percent (decreased 7 percent adjusted for currency).
OEM revenue of $2,746 million in 2011 decreased 2.3 percent
(3 percent adjusted for currency) compared to 2010, driven by the
Microelectronics OEM business.