IBM 2012 Annual Report Download - page 48
Download and view the complete annual report
Please find page 48 of the 2012 IBM annual report below. You can navigate through the pages in the report by either clicking on the pages listed below, or by using the keyword search tool below to find specific information within the annual report.-
 1
1 -
2
-
3
-
4
-
5
-
6
-
7
-
8
-
9
-
10
-
11
-
12
-
13
-
14
-
15
-
16
-
17
-
18
-
19
-
20
-
21
-
22
-
23
-
24
-
25
-
26
-
27
-
28
-
29
-
30
-
31
-
32
-
33
-
34
-
35
-
36
-
37
-
 38
38 -
 39
39 -
 40
40 -
 41
41 -
 42
42 -
 43
43 -
 44
44 -
 45
45 -
 46
46 -
 47
47 -
 48
48 -
 49
49 -
 50
50 -
 51
51 -
 52
52 -
 53
53 -
 54
54 -
 55
55 -
 56
56 -
 57
57 -
 58
58 -
59
-
60
-
61
-
62
-
63
-
64
-
65
-
66
-
67
-
68
-
69
-
70
-
71
-
72
-
73
-
74
-
75
-
76
-
77
-
78
-
79
-
80
-
81
-
82
-
83
-
84
-
85
-
86
-
87
-
88
-
89
-
90
-
91
-
92
-
93
-
94
-
95
-
96
-
97
-
98
-
99
-
100
-
101
-
102
-
103
-
104
-
105
-
106
-
107
-
108
-
109
-
110
-
111
-
112
-
113
-
114
-
115
-
116
-
117
-
118
-
119
-
120
-
121
-
122
-
123
-
124
-
125
-
126
-
127
-
128
-
129
-
130
-
131
-
132
-
133
-
134
-
135
-
136
-
137
-
138
-
139
-
140
-
141
-
142
-
143
-
144
-
145
-
146
 |
 |

47
Management Discussion
International Business Machines Corporation and Subsidiary Companies
Global Services
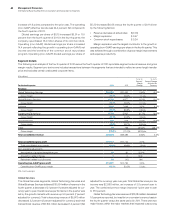
The Global Services segments, GTS and GBS, delivered $60,163
million of revenue in 2011, an increase of 6.6 percent (2 percent
adjusted for currency) compared to 2010. Services revenue per-
formance, adjusted for currency, was consistent over the course
of the year driven by stability in the backlog. Performance in 2011
was led by strength in the growth markets with total services rev-
enue up 16.9 percent (11 percent adjusted for currency) and gross
GTS revenue of $40,879 million increased 7.0 percent (3 percent
adjusted for currency) in 2011 versus 2010. Revenue performance
was led by the growth markets which were up 16.8 percent (11 per-
cent adjusted for currency). GTS Outsourcing revenue increased 7.5
percent (3 percent adjusted for currency) in 2011 and gained share.
Outsourcing performance in 2011 was driven by strength in the
growth markets with revenue up 11 percent, adjusted for currency,
as the outsourcing offerings are continuing to help clients build out
their IT infrastructures. ITS revenue increased 8.5 percent (4 percent
adjusted for currency) in 2011 versus 2010, also led by the growth
markets which increased 13 percent, adjusted for currency. Revenue
growth year over year, adjusted for currency, in both GTS Outsourc-
ing and ITS was relatively consistent over the course of the year.
GBS revenue of $19,284 million increased 5.8 percent (1 percent
adjusted for currency) in 2011 led by strength in the growth markets
with revenue up 17.4 percent (11 percent adjusted for currency).
Application Outsourcing revenue increased 9.5 percent (5 percent
adjusted for currency) in 2011 year to year. C&SI, which includes
Consulting, Application Management Services systems integration
and the U.S. Federal business, grew revenue in 2011 4.8 percent (1
percent adjusted for currency). Both GBS lines of business had
strong year-to-year performance in the growth markets with double-
digit constant currency revenue growth. GBS was impacted in 2011
by revenue declines in Japan and in the Public Sector; excluding
Japan and the Public Sector, total GBS revenue increased 11.9
percent in 2011 (8 percent adjusted for currency).
margin 2 points higher than in the major markets. The services
segments also had good performance in the other key growth
initiatives: cloud, business analytics and Smarter Planet. Total out-
sourcing revenue of $28,301 million increased 7.8 percent (3
percent adjusted for currency) and total transactional revenue of
$24,348 million increased 6.2 percent (2 percent adjusted for
currency) year to year.
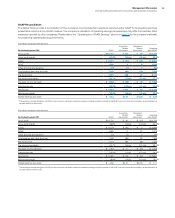
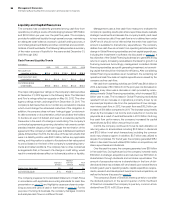
($ in millions)
For the year ended December 31: 2011 2010
Yr.-to-Yr.
Percent/
Margin
Change
Global Services
Global Technology Services
External gross profit $14,320 $13,194 8.5%
External gross profit margin 35.0% 34.5% 0.5 pts.
Pre-tax income $ 6,284 $ 5,499 14.3%
Pre-tax margin 14.9% 13.9%1.0 pts.
Pre-tax income—normalized* $ 6,399 $ 5,771 10.9%
Pre-tax margin—normalized 15.2% 14.6%0.6 pts.
Global Business Services
External gross profit $ 5,545 $ 5,106 8.6%
External gross profit margin 28.8% 28.0%0.7 pts.
Pre-tax income $ 3,006 $ 2,546 18.1%
Pre-tax margin 15.0%13.4%1.6 pts.
Pre-tax income—normalized** $ 3,052 $ 2,674 14.1%
Pre-tax margin—normalized 15.2%14.1%1.1 pts.
* Excludes $116 million and $273 million of workforce rebalancing charges in the first
quarter of 2011 and 2010, respectively.
** Excludes $45 million and $128 million of workforce rebalancing charges in the first
quarter of 2011 and 2010, respectively.
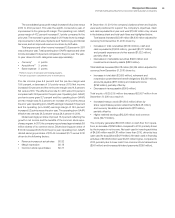
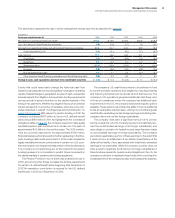
($ in millions)
For the year ended December 31: 2011 2010
Yr.-to-Yr.
Percent
Change
Yr.-to-Yr.
Percent Change
Adjusted for
Currency
Global Services external revenue $60,163 $56,424 6.6%2.3%
Global Technology Services $40,879 $38,201 7.0%2.7%
Outsourcing 23,911 22,241 7.5 3.0
Integrated Technology Services 9,453 8,714 8.5 4.1
Maintenance 7,515 7,250 3.6 (0.2)
Global Business Services $19,284 $18,223 5.8%1.5%
Outsourcing 4,390 4,007 9.5 4.8
Consulting and Systems Integration 14,895 14,216 4.8 0.5