IBM 2012 Annual Report Download - page 135
Download and view the complete annual report
Please find page 135 of the 2012 IBM annual report below. You can navigate through the pages in the report by either clicking on the pages listed below, or by using the keyword search tool below to find specific information within the annual report.-
 1
1 -
2
-
3
-
4
-
5
-
6
-
7
-
8
-
9
-
10
-
11
-
12
-
13
-
14
-
15
-
16
-
17
-
18
-
19
-
20
-
21
-
22
-
23
-
24
-
25
-
26
-
27
-
28
-
29
-
30
-
31
-
32
-
33
-
34
-
35
-
36
-
37
-
38
-
39
-
40
-
41
-
42
-
43
-
44
-
45
-
46
-
47
-
48
-
49
-
50
-
51
-
52
-
53
-
54
-
55
-
56
-
57
-
58
-
59
-
60
-
61
-
62
-
63
-
64
-
65
-
66
-
67
-
68
-
69
-
70
-
71
-
72
-
73
-
74
-
75
-
76
-
77
-
78
-
79
-
80
-
81
-
82
-
83
-
84
-
85
-
86
-
87
-
88
-
89
-
90
-
91
-
92
-
93
-
94
-
95
-
96
-
97
-
98
-
99
-
100
-
101
-
102
-
103
-
104
-
105
-
106
-
107
-
108
-
109
-
110
-
111
-
112
-
113
-
114
-
115
-
116
-
117
-
118
-
119
-
120
-
121
-
122
-
123
-
124
-
 125
125 -
 126
126 -
 127
127 -
 128
128 -
 129
129 -
 130
130 -
 131
131 -
 132
132 -
 133
133 -
 134
134 -
 135
135 -
 136
136 -
 137
137 -
 138
138 -
 139
139 -
 140
140 -
 141
141 -
 142
142 -
 143
143 -
 144
144 -
 145
145 -
146
 |
 |

134 Notes to Consolidated Financial Statements
International Business Machines Corporation and Subsidiary Companies
134
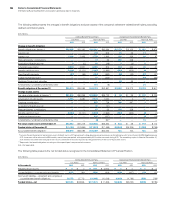
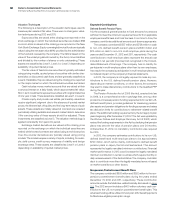
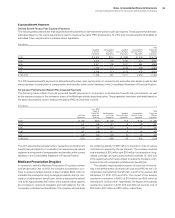
Other Plan Information
The following table presents information for defined benefit pension plans with accumulated benefit obligations (ABO) in excess of plan
assets. For a more detailed presentation of the funded status of the company’s defined benefit pension plans, see the table on page 124.
($ in millions)
2012 2011
At December 31:
Benefit
Obligation
Plan
Assets
Benefit
Obligation
Plan
Assets
Plans with PBO in excess of plan assets $99,184 $83,799 $83,777 $70,570
Plans with ABO in excess of plan assets 98,263 83,677 83,184 70,512
Plans with assets in excess of PBO 6,944 7,889 13,169 16,011
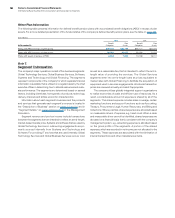
Note T.
Segment Information
The company’s major operations consist of five business segments:
Global Tech nol ogy Services, Global Business Services, Software,
Systems and Technology and Global Financing. The segments
represent components of the company for which separate financial
information is available that is utilized on a regular basis by the chief
executive officer in determining how to allocate resources and evalu-
ate performance. The segments are determined based on several
factors, including client base, homogeneity of products, technology,
delivery channels and similar economic characteristics.
Information about each segment’s business and the products
and services that generate each segment’s revenue is located in
the “Description of Business” section on pages 23 and 24, and in
“Segment Details,” on pages 26 through 31 in the Management
Discussion.
Segment revenue and pre-tax income include transactions
between the segments that are intended to reflect an arm’s-length,
market-based transfer price. Systems and software that are used by
Global Technology Services in outsourcing engagements are pri-
marily sourced internally from Systems and Technology and
Software. For providing IT services that are used internally, Global
Technology Services and Global Business Services recover cost,
as well as a reasonable fee, that is intended to reflect the arm’s-
length value of providing the services. The Global Services
segments enter into arm’s-length loans at prices equivalent to
market rates with Global Financing to facilitate the acquisition of
equipment used in services engagements. All internal transaction
prices are reviewed annually, and reset if appropriate.
The company utilizes globally integrated support organizations
to realize economies of scale and efficient use of resources. As a
result, a considerable amount of expense is shared by all of the
segments. This shared expense includes sales coverage, certain
marketing functions and support functions such as Accounting,
Treasury, Procurement, Legal, Human Re sources, and Billing and
Collections. Where practical, shared expenses are allocated based
on measurable drivers of expense, e.g., head count. When a clear
and measurable driver cannot be identified, shared expenses are
allocated on a financial basis that is consistent with the company’s
management system, e.g., advertising expense is allocated based
on the gross profits of the segments. A portion of the shared
expenses, which are recorded in net income, are not allocated to the
segments. These expenses are associated with the elimination of
internal transactions and other miscellaneous items.