IBM 2012 Annual Report Download - page 36
Download and view the complete annual report
Please find page 36 of the 2012 IBM annual report below. You can navigate through the pages in the report by either clicking on the pages listed below, or by using the keyword search tool below to find specific information within the annual report.-
 1
1 -
2
-
3
-
4
-
5
-
6
-
7
-
8
-
9
-
10
-
11
-
12
-
13
-
14
-
15
-
16
-
17
-
18
-
19
-
20
-
21
-
22
-
23
-
24
-
25
-
 26
26 -
 27
27 -
 28
28 -
 29
29 -
 30
30 -
 31
31 -
 32
32 -
 33
33 -
 34
34 -
 35
35 -
 36
36 -
 37
37 -
 38
38 -
 39
39 -
 40
40 -
 41
41 -
 42
42 -
 43
43 -
 44
44 -
 45
45 -
 46
46 -
47
-
48
-
49
-
50
-
51
-
52
-
53
-
54
-
55
-
56
-
57
-
58
-
59
-
60
-
61
-
62
-
63
-
64
-
65
-
66
-
67
-
68
-
69
-
70
-
71
-
72
-
73
-
74
-
75
-
76
-
77
-
78
-
79
-
80
-
81
-
82
-
83
-
84
-
85
-
86
-
87
-
88
-
89
-
90
-
91
-
92
-
93
-
94
-
95
-
96
-
97
-
98
-
99
-
100
-
101
-
102
-
103
-
104
-
105
-
106
-
107
-
108
-
109
-
110
-
111
-
112
-
113
-
114
-
115
-
116
-
117
-
118
-
119
-
120
-
121
-
122
-
123
-
124
-
125
-
126
-
127
-
128
-
129
-
130
-
131
-
132
-
133
-
134
-
135
-
136
-
137
-
138
-
139
-
140
-
141
-
142
-
143
-
144
-
145
-
146
 |
 |

35
Management Discussion
International Business Machines Corporation and Subsidiary Companies
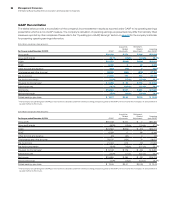
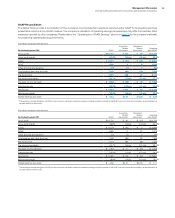
As discussed in the “Operating (non-GAAP) Earnings” section
on page 18, the company characterizes certain retirement-related
costs as operating and others as non-operating. Utilizing this
characterization, operating retirement-related costs in 2012 were
$1,851 million, a decrease of $54 million compared to 2011, primarily
driven by the $56 million decrease in service cost. Non-operating
costs of $538 million increased $610 million in 2012, compared
to the prior year, driven primarily by the increase in recognized actu-
arial losses ($619 million), lower expected return on plan assets
($219 million) and the charge related to the UK pension litigation
($162 million), partially offset by lower interest cost ($363 million).
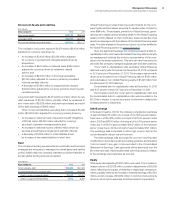
Income Taxes
The effective tax rate for 2012 was 24.2 percent compared with
24.5 percent in 2011. The operating (non-GAAP) tax rate for 2012
was 24.0 percent compared with 24.5 percent in 2011. The 0.3 point
decrease in the as-reported effective tax rate was primarily driven
by a more favorable geographic mix of pre-tax earnings (2.6 points)
and the one-time benefit in the first quarter associated with a tax
restructuring in Latin America (0.8 points), primarily offset by a
decrease in the utilization of foreign tax credits in 2012 (2.9 points)
and the unfavorable tax impact of the gain on the RSS divestiture
(0.3 points).The remaining items were individually insignificant.
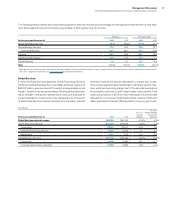
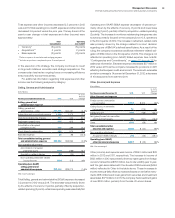
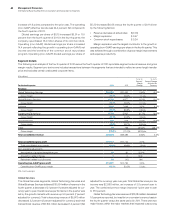
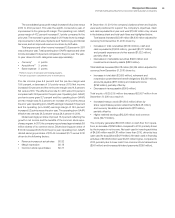
Earnings Per Share
Basic earnings per share is computed on the basis of the weighted-
average number of shares of common stock outstanding during
the period. Diluted earnings per share is computed on the basis of
the weighted-average number of shares of common stock out-
standing plus the effect of dilutive potential common shares
outstanding during the period using the treasury stock method.
Dilutive potential common shares include outstanding stock options
and stock awards.
For the year ended December 31: 2012 2011
Yr.-to-Yr.
Percent
Change
Earnings per share of common stock
Assuming dilution $14.37 $13.06 10.0%
Basic $14.53 $13.25 9.7%
Diluted operating (non-GAAP) $15.25 $13.44 13.5%
Weighted-average shares
outstanding (in millions)
Assuming dilution 1,155.4 1,213.8 (4.8)%
Basic 1,142.5 1,197.0 (4.5)%
Actual shares outstanding at December 31, 2012 and 2011 were
1,117.4 million and 1,163.2 million, respectively. The average number
of common shares outstanding assuming dilution was 58.3 million
shares lower in 2012 versus 2011. The decrease was primarily the
result of the common stock repurchase program. See note L,
“Equity Activity,” on page 107 for additional information regarding
common stock activities. Also see note P, “Earnings Per Share of
Common Stock,” on page 116.
Financial Position
Dynamics
At December 31, 2012, the company’s balance sheet and liquidity
positions remained strong and well-positioned to support the com-
pany’s long-term objectives. Cash and marketable securities at
year end were $11,128 million, a decrease of $794 million from the
prior year-end position. During the year the company continued to
manage the investment portfolio to meet its capital preservation
and liquidity objectives. At December 31, 2012, there were no hold-
ings of European sovereign debt securities in the investment
portfolio.
Total debt of $33,269 million increased $1,949 million from the
prior year-end level. The commercial paper balance at December
31, 2012 was $1,800 million, a decrease of $500 million from the
prior year. Within total debt, $24,501 million is in support of the
Global Financing business which is leveraged at a 7.0 to 1 ratio.
The company continues to have substantial flexibility in the market.
During 2012, the company completed bond issuances totaling
$7,875 million, with terms ranging from three to 30 years and priced
from 0.55 to 4.00 percent depending on the maturity. The com-
pany has consistently generated strong cash flow from operations
and continues to have access to additional sources of liquidity
through the capital markets and its $10 billion global credit facility,
with 100 percent of the facility available on a same-day basis.
Consistent with accounting standards, the company remeasures
the funded status of its retirement and postretirement plans at
December 31. At December 31, 2012, the overall net underfunded
position was $20,190 million, an increase of $3,800 million from
December 31, 2011, as the increase in the benefit obligation due to
the reduction in discount rates more than offset the returns on plan
assets. At year end, the company’s qualified defined benefit plans
were well funded and the cash requirements related to these plans
remain stable going forward at approximately $1 billion per year
through 2015. In 2012, the return on the U.S. Personal Pension Plan
assets was 11.3 percent and the plan was 98 percent funded. Over-
all, global asset returns were 11.1 percent and the company’s
qualified defined benefit plans worldwide were 94 percent funded.
The company’s qualified defined benefit plans do hold European
sovereign debt securities in their trust funds. See note S, “Retire-
ment-Related Benefits,” on page 128 for additional information.
During 2012, the company generated $19,586 million in cash
from operations, a decrease of $260 million compared to 2011. In
addition, the company generated $18,185 million in free cash flow
in 2012, an increase of $1,581 million over the prior year. See pages
56 and 57 for additional information on free cash flow. The com-
pany returned $15,768 million to shareholders in 2012, with $11,995
million in gross share repurchases and $3,773 million in dividends.
In 2012, the company repurchased approximately 61 million shares
and had $8.7 billion remaining in share repurchase authorization
at year end. The company’s strong cash generation permits the
company to invest and deploy capital to areas with the most
attractive long-term opportunities.