IBM 2012 Annual Report Download - page 123
Download and view the complete annual report
Please find page 123 of the 2012 IBM annual report below. You can navigate through the pages in the report by either clicking on the pages listed below, or by using the keyword search tool below to find specific information within the annual report.-
 1
1 -
2
-
3
-
4
-
5
-
6
-
7
-
8
-
9
-
10
-
11
-
12
-
13
-
14
-
15
-
16
-
17
-
18
-
19
-
20
-
21
-
22
-
23
-
24
-
25
-
26
-
27
-
28
-
29
-
30
-
31
-
32
-
33
-
34
-
35
-
36
-
37
-
38
-
39
-
40
-
41
-
42
-
43
-
44
-
45
-
46
-
47
-
48
-
49
-
50
-
51
-
52
-
53
-
54
-
55
-
56
-
57
-
58
-
59
-
60
-
61
-
62
-
63
-
64
-
65
-
66
-
67
-
68
-
69
-
70
-
71
-
72
-
73
-
74
-
75
-
76
-
77
-
78
-
79
-
80
-
81
-
82
-
83
-
84
-
85
-
86
-
87
-
88
-
89
-
90
-
91
-
92
-
93
-
94
-
95
-
96
-
97
-
98
-
99
-
100
-
101
-
102
-
103
-
104
-
105
-
106
-
107
-
108
-
109
-
110
-
111
-
112
-
 113
113 -
 114
114 -
 115
115 -
 116
116 -
 117
117 -
 118
118 -
 119
119 -
 120
120 -
 121
121 -
 122
122 -
 123
123 -
 124
124 -
 125
125 -
 126
126 -
 127
127 -
 128
128 -
 129
129 -
 130
130 -
 131
131 -
 132
132 -
 133
133 -
134
-
135
-
136
-
137
-
138
-
139
-
140
-
141
-
142
-
143
-
144
-
145
-
146
 |
 |

122 Notes to Consolidated Financial Statements
International Business Machines Corporation and Subsidiary Companies
122
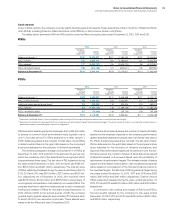
Plan Financial Information
Summary of Financial Information
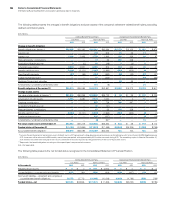
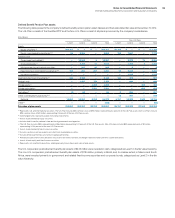
The following table presents a summary of the total retirement-related benefits net periodic (income)/cost recorded in the Consolidated
Statement of Earnings.
($ in millions)
U.S. Plans Non-U.S. Plans Tot a l
For the year ended December 31: 2012 2011 2010 2012 2011 2010 2012 2011 2010
Defined benefit pension plans $(526) $(774) $(949) $1,040 $ 734 $ 541 $ 515 $ (40)$ (408)
Retention Plan 18 15 14 —— — 18 15 14
Total defined benefit
pension plans (income)/cost $(507) $(759) $(935) $1,040 $ 734 $ 541 $ 533 $ (25)$ (394)
IBM 401(k) Plus Plan
and Non-U.S. plans $ 857 $ 875 $ 882 $ 621 $ 608 $ 527 $1,478 $1,483 $1,409
Excess 401(k) 29 30 20 —— — 29 30 20
Total defined contribution plans cost $ 885 $ 905 $ 902 $ 621 $ 608 $ 527 $1,506 $1,513 $1,430
Nonpension postretirement
benefit plans cost $ 268 $ 269 $ 281 $ 82 $ 76 $ 66 $ 350 $ 345 $ 347
Total retirement-related
benefits net periodic cost $ 646 $ 415 $ 248 $1,743 $1,418 $1,134 $2,389 $1,832 $1,382
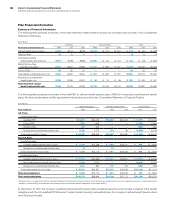
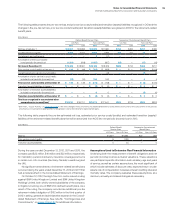
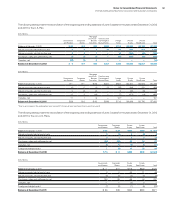
The following table presents a summary of the total PBO for defined benefit pension plans, APBO for nonpension postretirement benefit
plans, fair value of plan assets and the associated funded status recorded in the Consolidated Statement of Financial Position.
($ in millions)
Benefit Obligations Fair Value of Plan Assets Funded Status*
At December 31: 2012 2011 2012 2011 2012 2011
U.S. Plans
Underfunded plans
Qualified PPP $ 54,907 $52,318 $53,630 $51,218 $ (1,277) $ (1,100)
Excess PPP 1,576 1,462 ——(1,576) (1,462)
Retention Plan 327 305 ——(327) (305)
Nonpension postretirement benefit plan 5,282 5,273 433 38 (4,849) (5,235)
Total underfunded U.S. plans $ 62,092 $59,358 $54,063 $51,256 $ (8,029) $ (8,102)
Non-U.S. Plans
Overfunded plans
Qualified defined benefit pension plans $ 6,944 $13,169 $ 7,889 $16,011 $ 945 $ 2,843
Nonpension postretirement benefit plans 12 712 700
Total overfunded non-U.S. plans $ 6,956 $13,175 $ 7,901 $16,018 $ 945 $ 2,843
Underfunded plans
Qualified defined benefit pension plans $ 35,956 $24,659 $30,169 $19,351 $ (5,788) $ (5,308)
Nonqualified defined benefit pension plans 6,418 5,033 ——(6,418) (5,033)
Nonpension postretirement benefit plans 1,007 894 107 105 (900) (789)
Total underfunded non-U.S. plans $ 43,381 $30,587 $30,276 $19,456 $(13,106) $(11,131)
Total overfunded plans $ 6,956 $13,175 $ 7,901 $16,018 $ 945 $ 2,843
Total underfunded plans $105,473 $89,944 $84,338 $70,712 $(21,134) $(19,232)
* Funded status is recognized in the Consolidated Statement of Financial Position as follows: Asset amounts as prepaid pension assets; (Liability) amounts as compensation and
benefits (current liability) and retirement and nonpension postretirement benefit obligations (noncurrent liability).
At December 31, 2012, the company’s qualified defined benefit pension plans worldwide were 94 percent funded compared to the benefit
obligations, with the U.S. qualified PPP 98 percent funded. Overall, including nonqualifed plans, the company’s defined benefit pension plans
were 86 percent funded.