IBM 2012 Annual Report Download - page 43
Download and view the complete annual report
Please find page 43 of the 2012 IBM annual report below. You can navigate through the pages in the report by either clicking on the pages listed below, or by using the keyword search tool below to find specific information within the annual report.-
 1
1 -
2
-
3
-
4
-
5
-
6
-
7
-
8
-
9
-
10
-
11
-
12
-
13
-
14
-
15
-
16
-
17
-
18
-
19
-
20
-
21
-
22
-
23
-
24
-
25
-
26
-
27
-
28
-
29
-
30
-
31
-
32
-
 33
33 -
 34
34 -
 35
35 -
 36
36 -
 37
37 -
 38
38 -
 39
39 -
 40
40 -
 41
41 -
 42
42 -
 43
43 -
 44
44 -
 45
45 -
 46
46 -
 47
47 -
 48
48 -
 49
49 -
 50
50 -
 51
51 -
 52
52 -
 53
53 -
54
-
55
-
56
-
57
-
58
-
59
-
60
-
61
-
62
-
63
-
64
-
65
-
66
-
67
-
68
-
69
-
70
-
71
-
72
-
73
-
74
-
75
-
76
-
77
-
78
-
79
-
80
-
81
-
82
-
83
-
84
-
85
-
86
-
87
-
88
-
89
-
90
-
91
-
92
-
93
-
94
-
95
-
96
-
97
-
98
-
99
-
100
-
101
-
102
-
103
-
104
-
105
-
106
-
107
-
108
-
109
-
110
-
111
-
112
-
113
-
114
-
115
-
116
-
117
-
118
-
119
-
120
-
121
-
122
-
123
-
124
-
125
-
126
-
127
-
128
-
129
-
130
-
131
-
132
-
133
-
134
-
135
-
136
-
137
-
138
-
139
-
140
-
141
-
142
-
143
-
144
-
145
-
146
 |
 |

4242 Management Discussion
International Business Machines Corporation and Subsidiary Companies
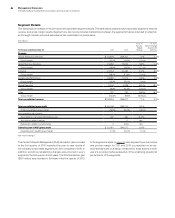
Oracle/Sun and half from Hewlett Packard. System x revenue
decreased 2.5 percent (3 percent adjusted for currency) in the fourth
quarter year to year. Storage hardware revenue decreased 5.4 per-
cent (5 percent adjusted for currency) driven by tape products. Total
tape revenue decreased 23 percent (23 percent adjusted for cur-
rency) while total disk revenue was essentially flat year to year. Within
disk, the company announced the new high-end DS8870 in October
2012, and the product was sold out in the fourth quarter. Systems
and Technology gross margin increased 3.6 points to 44.1 percent
driven primarily by a mix to the higher margin System z in the fourth
quarter of 2012. Systems and Technology’s pre-tax income
increased 23.2 percent to $974 million in the fourth quarter and the
pre-tax margin increased 3.2 points to 16.4 percent. Systems and
Technology’s profit performance was driven by the new product
introductions in mainframe, Power, Storage and PureSystems.
Global Financing
Global Financing revenue of $535 million decreased 2.3 percent (1
percent adjusted for currency), driven by a decrease in financing
revenue, partially offset by an increase in used equipment sales
revenue. The Global Financing fourth-quarter pre-tax income
increased 0.7 percent to $518 million and the pre-tax margin
increased 0.9 points to 46.9 percent.
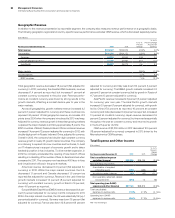
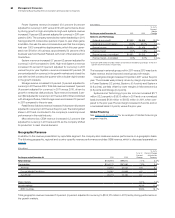
Geographic Revenue
Total geographic revenue of $28,624 million decreased 0.5 percent
(flat adjusted for currency) in the fourth quarter of 2012 compared
to the prior year. Americas revenue of $12,550 million increased 0.3
percent (1 percent adjusted for currency) in 2012, led by strong
growth in Latin America (up 13.5 percent as reported and 18 percent
adjusted for currency). The U.S. was down 0.7 percent, but the
growth rate improved 3 points compared to the third quarter of 2012.
Canada was down 6.2 percent (9 percent adjusted for currency)
compared to strong year-to-year growth of 13 percent at constant
currency in the fourth quarter of 2011. EMEA revenue of $9,091
million decreased 5.0 percent (3 percent adjusted for currency),
reflecting the macroeconomic climate in that region. Germany was
down 7.0 percent (4 percent adjusted for currency) and the UK was
down 4.7 percent (7 percent adjusted for currency). Italy revenue
decreased 3.4 percent (flat adjusted for currency), an improvement
sequentially from the third-quarter constant currency growth rate.
Asia Pacific revenue of $6,984 million increased 4.2 percent (5 per-
cent adjusted for currency) led by Japan, which returned to growth
(0.2 percent as reported, 5 percent at constant currency) in the
fourth quarter of 2012. Across all geographies, revenue from the
growth markets increased 6.8 percent (7 percent adjusted for cur-
rency) in the fourth quarter and outpaced growth in the major
markets by 9 points on a constant currency basis. Revenue perfor-
mance was again broad based with over 30 growth market
countries delivering double-digit revenue growth year to year,
adjusted for currency. Within the BRIC countries, combined revenue
increased 11.4 percent (14 percent adjusted for currency), the stron-
gest quarterly growth in 2012. Brazil returned to growth in the fourth
quarter with revenue up 15.5 percent (24 percent adjusted for cur-
rency). The growth markets also had good performance in Africa,
led by South Africa, and in the Middle East.
OEM revenue of $679 million in the fourth quarter decreased
4.9 percent (5 percent adjusted for currency) compared to the
prior year.
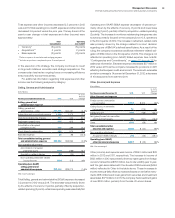
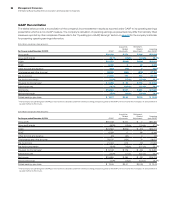
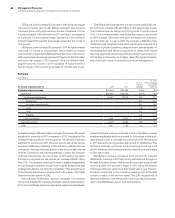
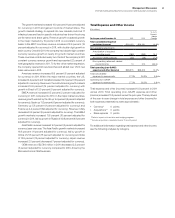
Total Expense and Other Income
($ in millions)
For the fourth quarter: 2012 2011
Yr.-to-Yr.
Percent/
Margin
Change
Total consolidated expense
and other (income) $7,336 $7,448 (1.5)%
Non-operating adjustments
Amortization of acquired
intangible assets (86) (72) 19.6
Acquisition-related charges (12) (13) (8.2)
Non-operating retirement-related
(costs)/income (23) 25 NM
Total operating (non-GAAP)
expense and other (income) $7,215 $7,388 (2.3)%
Total consolidated
expense-to-revenue ratio 25.0% 25.3%(0.2) pts.
Operating (non-GAAP)
expense-to-revenue ratio 24.6% 25.1%(0.4) pts.
NM—Not meaningful
Total expense and other income decreased 1.5 percent year to year
in the fourth quarter with an expense-to-revenue-ratio of 25.0 per-
cent compared to 25.3 percent in the fourth quarter of 2011. Total
operating (non-GAAP) expense and other income decreased 2.3
percent in the fourth quarter. The decrease in total expense and
other income was primarily driven by lower base expense (3 points)
and currency (1 point), partially offset by increased expense from
the company’s acquisitions over the past 12 months (2 points).
Within Selling, general and administrative expense, accounts receiv-
able provisions were approximately $20 million in the fourth quarter
of 2012 an improvement of nearly $70 million from the fourth quarter
of 2011 when provisions were increased to reflect the European
credit environment.
Cash Flow
The company generated $6,346 million in cash flow provided by
operating activities, a decrease of $751 million compared to the
fourth quarter of 2011, driven primarily by an increase in cash used
in operating assets and liabilities ($889 million). Net cash used in
investing activities of $4,092 million increased $587 million primarily
due to an increase in cash used by non-operating finance receiv-
ables ($501 million) and an increase in cash used from net purchases
of marketable securities and other investments ($300 million). Net
cash used in financing activities of $3,791 million increased $982
million compared to the prior year primarily due to a net decrease
in cash from total debt ($1,397 million); partially offset by a decrease
in cash used for gross common stock repurchases ($575 million).