IBM 2012 Annual Report Download - page 47
Download and view the complete annual report
Please find page 47 of the 2012 IBM annual report below. You can navigate through the pages in the report by either clicking on the pages listed below, or by using the keyword search tool below to find specific information within the annual report.-
 1
1 -
2
-
3
-
4
-
5
-
6
-
7
-
8
-
9
-
10
-
11
-
12
-
13
-
14
-
15
-
16
-
17
-
18
-
19
-
20
-
21
-
22
-
23
-
24
-
25
-
26
-
27
-
28
-
29
-
30
-
31
-
32
-
33
-
34
-
35
-
36
-
 37
37 -
 38
38 -
 39
39 -
 40
40 -
 41
41 -
 42
42 -
 43
43 -
 44
44 -
 45
45 -
 46
46 -
 47
47 -
 48
48 -
 49
49 -
 50
50 -
 51
51 -
 52
52 -
 53
53 -
 54
54 -
 55
55 -
 56
56 -
 57
57 -
58
-
59
-
60
-
61
-
62
-
63
-
64
-
65
-
66
-
67
-
68
-
69
-
70
-
71
-
72
-
73
-
74
-
75
-
76
-
77
-
78
-
79
-
80
-
81
-
82
-
83
-
84
-
85
-
86
-
87
-
88
-
89
-
90
-
91
-
92
-
93
-
94
-
95
-
96
-
97
-
98
-
99
-
100
-
101
-
102
-
103
-
104
-
105
-
106
-
107
-
108
-
109
-
110
-
111
-
112
-
113
-
114
-
115
-
116
-
117
-
118
-
119
-
120
-
121
-
122
-
123
-
124
-
125
-
126
-
127
-
128
-
129
-
130
-
131
-
132
-
133
-
134
-
135
-
136
-
137
-
138
-
139
-
140
-
141
-
142
-
143
-
144
-
145
-
146
 |
 |

4646 Management Discussion
International Business Machines Corporation and Subsidiary Companies
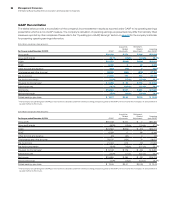
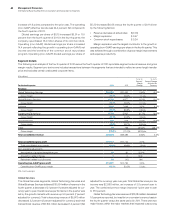
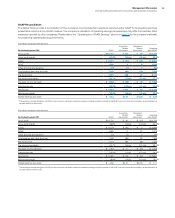
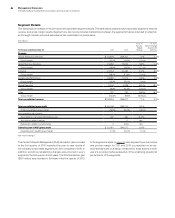
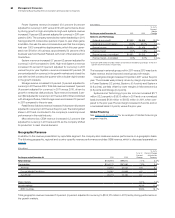
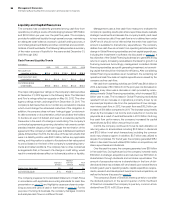
Segment Details
The following is an analysis of the 2011 and 2010 reportable segment results. The table below presents each reportable segment’s external
revenue and gross margin results. Segment pre-tax income includes transactions between the segments that are intended to reflect an
arm’s-length transfer price and excludes certain unallocated corporate items.
($ in millions)
For the year ended December 31: 2011 2010
Yr.-to-Yr.
Percent/
Margin
Change
Yr.-to-Yr.
Percent Change
Adjusted for
Currency
Revenue
Global Technology Services $ 40,879 $38,201 7.0%2.7%
Gross margin 35.0% 34.5% 0.5 pts.
Global Business Services 19,284 18,223 5.8%1.5%
Gross margin 28.8% 28.0% 0.7 pts.
Software 24,944 22,485 10.9%8.0%
Gross margin 88.5% 87.9% 0.5 pts.
Systems and Technology 18,985 17,973 5.6%3.2%
Gross margin 39.8% 38.1% 1.6 pts.
Global Financing 2,102 2,238 (6.1)% (9.1)%
Gross margin 49.8% 51.3% (1.5 ) pts.
Other 722 750 (3.8)% (6.3)%
Gross margin (54.5)% (8.6)% (45.9) pts.
Total consolidated revenue $106,916 $99,870 7.1%3.4%
Total consolidated gross profit $ 50,138 $46,014 9.0%
Total consolidated gross margin 46.9% 46.1% 0.8 pts.
Non-operating adjustments
Amortization of acquired intangible assets 340 260 30.8%
Acquisition-related charges 1 0 NM
Retirement-related costs/(income) 2 (204)NM
Operating (non-GAAP) gross profit $ 50,481 $46,070 9.6%
Operating (non-GAAP) gross margin 47.2% 46.1% 1.1 pts.
NM—Not meaningful
The Product Lifecycle Management (PLM) transaction gain recorded
in the first quarter of 2010 impacted the year-to-year results of
the company’s reportable segments for 2011 compared to 2010. In
addition, workforce rebalancing charges were incurred in every
segment in the first quarter of both years. The PLM transaction gain
($591 million) was recorded in Software in the first quarter of 2010.
In the segment analysis on page 47, each segment’s pre-tax income
and pre-tax margin for 2011 and 2010 is presented on an as-
reported basis and on a basis normalized for these actions in both
years to provide a better perspective of the underlying operational
performance of the segments.