IBM 2012 Annual Report Download - page 71
Download and view the complete annual report
Please find page 71 of the 2012 IBM annual report below. You can navigate through the pages in the report by either clicking on the pages listed below, or by using the keyword search tool below to find specific information within the annual report.-
 1
1 -
2
-
3
-
4
-
5
-
6
-
7
-
8
-
9
-
10
-
11
-
12
-
13
-
14
-
15
-
16
-
17
-
18
-
19
-
20
-
21
-
22
-
23
-
24
-
25
-
26
-
27
-
28
-
29
-
30
-
31
-
32
-
33
-
34
-
35
-
36
-
37
-
38
-
39
-
40
-
41
-
42
-
43
-
44
-
45
-
46
-
47
-
48
-
49
-
50
-
51
-
52
-
53
-
54
-
55
-
56
-
57
-
58
-
59
-
60
-
 61
61 -
 62
62 -
 63
63 -
 64
64 -
 65
65 -
 66
66 -
 67
67 -
 68
68 -
 69
69 -
 70
70 -
 71
71 -
 72
72 -
 73
73 -
 74
74 -
 75
75 -
 76
76 -
 77
77 -
 78
78 -
 79
79 -
 80
80 -
 81
81 -
82
-
83
-
84
-
85
-
86
-
87
-
88
-
89
-
90
-
91
-
92
-
93
-
94
-
95
-
96
-
97
-
98
-
99
-
100
-
101
-
102
-
103
-
104
-
105
-
106
-
107
-
108
-
109
-
110
-
111
-
112
-
113
-
114
-
115
-
116
-
117
-
118
-
119
-
120
-
121
-
122
-
123
-
124
-
125
-
126
-
127
-
128
-
129
-
130
-
131
-
132
-
133
-
134
-
135
-
136
-
137
-
138
-
139
-
140
-
141
-
142
-
143
-
144
-
145
-
146
 |
 |

70
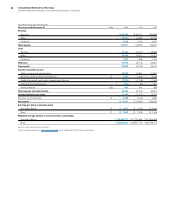
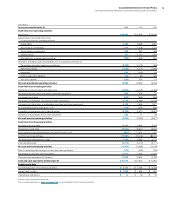
70 Consolidated Statement of Earnings
International Business Machines Corporation and Subsidiary Companies
($ in millions except per share amounts)
For the year ended December 31: Notes 2012 2011 2010
Revenue
Services $ 59,453 $ 60,721 $56,868
Sales 43,014 44,063 40,736
Financing 2,040 2,132 2,267
Total revenue 104,507 106,916 99,870
Cost
Services 39,166 40,740 38,383
Sales 13,956 14,973 14,374
Financing 1,087 1,065 1,100
Total cost 54,209 56,778 53,857
Gross profit 50,298 50,138 46,014
Expense and other income
Selling, general and administrative 23,553 23,594 21,837
Research, development and engineering O6,302 6,258 6,026
Intellectual property and custom development income (1,074)(1,108)(1,154)
Other (income) and expense (843)(20)(787)
Interest expense D&J 459 411 368
Total expense and other income 28,396 29,135 26,291
Income before income taxes 21,902 21,003 19,723
Provision for income taxes N5,298 5,148 4,890
Net income $ 16,604 $ 15,855 $14,833
Earnings per share of common stock
Assuming dilution P$ 14.37 $ 13.06 $ 11.52
Basic P$ 14.53 $ 13.25 $ 11.69
Weighted-average number of common shares outstanding
Assuming dilution 1,155,449,317 1,213,767,985 1,287,355,388
Basic 1,142,508,521 1,196,951,006 1,268,789,202
Amounts may not add due to rounding.
The accompanying notes on pages 76 through 138 are an integral part of the financial statements.