IBM 2012 Annual Report Download - page 33
Download and view the complete annual report
Please find page 33 of the 2012 IBM annual report below. You can navigate through the pages in the report by either clicking on the pages listed below, or by using the keyword search tool below to find specific information within the annual report.-
 1
1 -
2
-
3
-
4
-
5
-
6
-
7
-
8
-
9
-
10
-
11
-
12
-
13
-
14
-
15
-
16
-
17
-
18
-
19
-
20
-
21
-
22
-
 23
23 -
 24
24 -
 25
25 -
 26
26 -
 27
27 -
 28
28 -
 29
29 -
 30
30 -
 31
31 -
 32
32 -
 33
33 -
 34
34 -
 35
35 -
 36
36 -
 37
37 -
 38
38 -
 39
39 -
 40
40 -
 41
41 -
 42
42 -
 43
43 -
44
-
45
-
46
-
47
-
48
-
49
-
50
-
51
-
52
-
53
-
54
-
55
-
56
-
57
-
58
-
59
-
60
-
61
-
62
-
63
-
64
-
65
-
66
-
67
-
68
-
69
-
70
-
71
-
72
-
73
-
74
-
75
-
76
-
77
-
78
-
79
-
80
-
81
-
82
-
83
-
84
-
85
-
86
-
87
-
88
-
89
-
90
-
91
-
92
-
93
-
94
-
95
-
96
-
97
-
98
-
99
-
100
-
101
-
102
-
103
-
104
-
105
-
106
-
107
-
108
-
109
-
110
-
111
-
112
-
113
-
114
-
115
-
116
-
117
-
118
-
119
-
120
-
121
-
122
-
123
-
124
-
125
-
126
-
127
-
128
-
129
-
130
-
131
-
132
-
133
-
134
-
135
-
136
-
137
-
138
-
139
-
140
-
141
-
142
-
143
-
144
-
145
-
146
 |
 |

3232 Management Discussion
International Business Machines Corporation and Subsidiary Companies
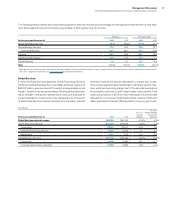
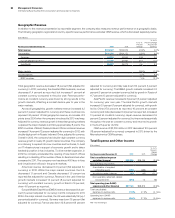
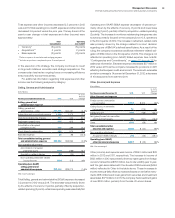
Geographic Revenue
In addition to the revenue presentation by reportable segment, the company also measures revenue performance on a geographic basis.
The following geographic, regional and country-specific revenue performance excludes OEM revenue, which is discussed separately below.
($ in millions)
For the year ended December 31: 2012 2011
Yr.-to-Yr.
Percent
Change
Yr.-to-Yr.
Percent Change
Adjusted for
Currency
Total revenue $104,507 $106,916 (2.3)% 0.0%
Geographies $102,268 $104,170 (1.8)% 0.5%
Americas 44,556 44,944 (0.9)0.0
Europe/Middle East/Africa 31,775 33,952 (6.4)(1.0)
Asia Pacific 25,937 25,273 2.6 3.3
Major markets (3.5)% (1.3)%
Growth markets 4.2%6.9%
BRIC countries 7.4%12.2%
Total geographic revenue decreased 1.8 percent (flat adjusted for
currency) in 2012; excluding the divested RSS business, revenue
decreased 1.4 percent as reported, but increased 1 percent at
constant currency compared to the prior year. Revenue perfor-
mance at constant currency was driven by strong results in the
growth markets, offsetting a modest decline year to year in the
major markets.
Across all geographies, growth markets revenue increased 4.2
percent (7 percent adjusted for currency) and these countries now
represent 24 percent of total geographic revenue, an increase of 8
points since 2006 when the company introduced its 2010 road map.
Adjusted for currency, revenue growth in these fast growing markets
outpaced the major markets in 2012 by approximately 8 points. The
BRIC countries of Brazil, Russia, India and China combined revenue
increased 7.4 percent (12 percent adjusted for currency) in 2012, with
double-digit growth in Russia, India and China, adjusted for currency.
Overall in 2012, the company had double-digit constant currency
revenue growth in nearly 35 growth market countries. The company
is continuing to expand into new countries and territories, to build
out IT infrastructures in support of economic growth and to take a
leadership position in key industries. To drive market expansion, in
2012 the company accelerated the opening of new branch offices
resulting in a doubling of the number of face-to-face branches when
compared to 2011. The company now has almost 450 face-to-face
and virtual branch offices in the growth markets.
Americas revenue decreased 0.9 percent (flat adjusted for
currency) in 2012. Within the major market countries, the U.S.
decreased 1.1 percent and Canada decreased 1.5 percent as
reported (flat adjusted for currency). Revenue in the Latin America
growth markets increased 1.4 percent (8 percent adjusted for
currency) with constant currency growth in Brazil of 6 percent,
down 4.6 percent as reported.
Europe/Middle East/Africa (EMEA) revenue decreased 6.4 per-
cent (1 percent adjusted for currency) in 2012 compared to 2011.
Within the major market countries, the UK was essentially flat (up 1
percent adjusted for currency), Germany was down 7.6 percent (flat
adjusted for currency), France was down 12.6 percent (6 percent
adjusted for currency) and Italy was down 8.4 percent (1 percent
adjusted for currency). The EMEA growth markets increased 0.8
percent (5 percent at constant currency) led by growth in Russia of
11.7 percent (13 percent adjusted for currency).
Asia Pacific revenue increased 2.6 percent (3 percent adjusted
for currency) year over year. The Asia Pacific growth markets
increased 6.0 percent (7 percent adjusted for currency), with growth
led by China (17.9 percent as reported, 16 percent at constant
currency) and India (decreased 0.9 percent as reported, increased
13 percent at constant currency). Japan revenue decreased 1.9
percent (2 percent adjusted for currency) but improved sequentially
throughout the year at constant currency and returned to growth
in the fourth quarter of 2012.
OEM revenue of $2,239 million in 2012 decreased 18.5 percent
(18 percent adjusted for currency) compared to 2011, driven by the
Microelectronics OEM business.
Total Expense and Other Income
($ in millions)
For the year ended December 31: 2012 2011
Yr.-to-Yr.
Percent/
Margin
Change
Total consolidated expense
and other (income) $28,396 $29,135 (2.5)%
Non-operating adjustments
Amortization of acquired
intangible assets (328) (289) 13.3
Acquisition-related charges (35) (45) (21.2)
Non-operating retirement-related
(costs)/income (274) 74 NM
Total operating (non-GAAP)
expense and other (income) $27,760 $28,875 (3.9)%
Total consolidated
expense-to-revenue ratio 27.2% 27.3% (0.1) pts.
Operating (non-GAAP)
expense-to-revenue ratio 26.6% 27.0%(0.4) pts.
NM—Not meaningful