IBM 2012 Annual Report Download - page 51
Download and view the complete annual report
Please find page 51 of the 2012 IBM annual report below. You can navigate through the pages in the report by either clicking on the pages listed below, or by using the keyword search tool below to find specific information within the annual report.-
 1
1 -
2
-
3
-
4
-
5
-
6
-
7
-
8
-
9
-
10
-
11
-
12
-
13
-
14
-
15
-
16
-
17
-
18
-
19
-
20
-
21
-
22
-
23
-
24
-
25
-
26
-
27
-
28
-
29
-
30
-
31
-
32
-
33
-
34
-
35
-
36
-
37
-
38
-
39
-
40
-
 41
41 -
 42
42 -
 43
43 -
 44
44 -
 45
45 -
 46
46 -
 47
47 -
 48
48 -
 49
49 -
 50
50 -
 51
51 -
 52
52 -
 53
53 -
 54
54 -
 55
55 -
 56
56 -
 57
57 -
 58
58 -
 59
59 -
 60
60 -
 61
61 -
62
-
63
-
64
-
65
-
66
-
67
-
68
-
69
-
70
-
71
-
72
-
73
-
74
-
75
-
76
-
77
-
78
-
79
-
80
-
81
-
82
-
83
-
84
-
85
-
86
-
87
-
88
-
89
-
90
-
91
-
92
-
93
-
94
-
95
-
96
-
97
-
98
-
99
-
100
-
101
-
102
-
103
-
104
-
105
-
106
-
107
-
108
-
109
-
110
-
111
-
112
-
113
-
114
-
115
-
116
-
117
-
118
-
119
-
120
-
121
-
122
-
123
-
124
-
125
-
126
-
127
-
128
-
129
-
130
-
131
-
132
-
133
-
134
-
135
-
136
-
137
-
138
-
139
-
140
-
141
-
142
-
143
-
144
-
145
-
146
 |
 |

5050 Management Discussion
International Business Machines Corporation and Subsidiary Companies
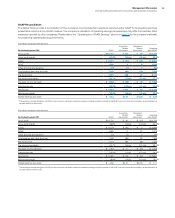
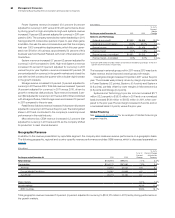
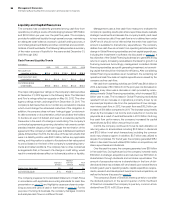
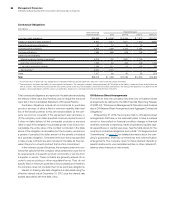
Geographic Revenue
In addition to the revenue presentation by reportable segment, the company also measures revenue performance on a geographic basis.
The following geographic, regional and country-specific revenue performance excludes OEM revenue, which is discussed separately on
page 51.
($ in millions)
For the year ended December 31: 2011 2010
Yr.-to-Yr.
Percent
Change
Yr.-to-Yr.
Percent Change
Adjusted for
Currency
Total revenue $106,916 $99,870 7.1% 3.4%
Geographies $104,170 $97,060 7.3% 3.6%
Americas 44,944 42,044 6.9 6.2
Europe/Middle East/Africa 33,952 31,866 6.5 1.6
Asia Pacific 25,273 23,150 9.2 1.7
Major markets 5.1% 1.6%
Growth markets 16.0% 11.4%
BRIC countries 18.6% 16.1%
Total geographic revenue increased 7.3 percent (4 percent adjusted for currency) to $104,170 million in 2011, led by strong performance in
the growth markets.
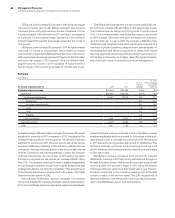
Power Systems revenue increased 12.0 percent (9 percent
adjusted for currency) in 2011 versus 2010 with performance driven
by strong growth in high-end systems. High-end systems revenue
increased 31 percent (28 percent adjusted for currency) in 2011 com-
pared to 2010. The company extended its market leadership in 2011,
having posted 15 consecutive quarters of year-to-year share gains.
In addition, this was the second consecutive year that the company
had over 1,000 competitive displacements, which this year gener-
ated over $1 billion of business; approximately 50 percent of this
business was from Hewlett Packard, with most of the balance from
Oracle/Sun.
System x revenue increased 5.7 percent (2 percent adjusted for
currency) in 2011 compared to 2010. High-end System x revenue
increased 35 percent (31 percent adjusted for currency) in 2011
versus the prior year. System x revenue increased 22 percent (18
percent adjusted for currency) in the growth markets and closed the
year with its ninth consecutive quarter with a double-digit increase
in the growth markets.
Storage revenue increased 5.8 percent (3 percent adjusted for
currency) in 2011 versus 2010. Total disk revenue increased 7 percent
(4 percent adjusted for currency) in 2011 versus 2010, driven by
growth in enterprise disk products. Tape revenue increased 3 per-
cent (flat adjusted for currency) in 2011 versus 2010. When combined
with storage software, total storage revenue increased 10 percent
in 2011 compared to the prior year.
Retail Stores Solutions revenue increased 11.6 percent (9 percent
adjusted for currency) in 2011 versus the prior year. The brand gained
share in 2011 and contributed to the company’s overall improved
performance in the retail industry.
Microelectronics OEM revenue increased 0.2 percent (flat
adjusted for currency) in 2011 versus 2010, as the company shifted
its production to meet internal demand.
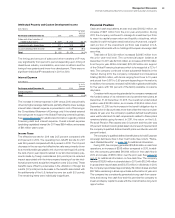
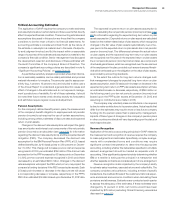
($ in millions)
For the year ended December 31: 2011 2010
Yr.-to-Yr.
Percent/
Margin
Change
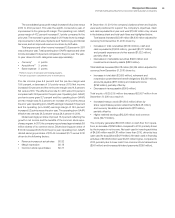
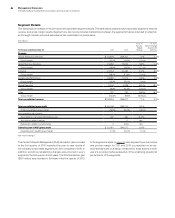
Systems and Technology
External gross profit $7,555 $6,856 10.2%
External gross profit margin 39.8% 38.1% 1.6 pts.
Pre-tax income $1,633 $1,456 12.2%
Pre-tax margin 8.2% 7.8%0.5 pts.
Pre-tax income—normalized* $1,652 $1,513 9.2%
Pre-tax margin—normalized 8.3%8.1%0.3 pts.
* Excludes $19 million and $57 million of workforce rebalancing charges in the first
quarter of 2011 and 2010, respectively.
The increase in external gross profit in 2011 versus 2010 was due to
higher revenue and an improved overall gross profit margin.
Overall gross margin increased 1.6 points in 2011 versus the prior
year. The increase was primarily driven by margin improvements
in Power Systems (1.2 points), System z (0.4 points) and System x
(0.6 points), partially offset by lower margins in Microelectronics
(0.6 points) and Storage (0.2 points).
Systems and Technology’s pre-tax income increased $177
million (12.2 percent) to $1,633 million in 2011 and on a normalized
basis increased $139 million to $1,652 million in 2011, when com-
pared to the prior year. Pre-tax margin increased 0.5 points, and on
a normalized basis 0.3 points, versus the prior year.
Global Financing
See pages 63 through 67 for an analysis of Global Financing’s
segment results.