IBM 2012 Annual Report Download - page 136
Download and view the complete annual report
Please find page 136 of the 2012 IBM annual report below. You can navigate through the pages in the report by either clicking on the pages listed below, or by using the keyword search tool below to find specific information within the annual report.-
 1
1 -
2
-
3
-
4
-
5
-
6
-
7
-
8
-
9
-
10
-
11
-
12
-
13
-
14
-
15
-
16
-
17
-
18
-
19
-
20
-
21
-
22
-
23
-
24
-
25
-
26
-
27
-
28
-
29
-
30
-
31
-
32
-
33
-
34
-
35
-
36
-
37
-
38
-
39
-
40
-
41
-
42
-
43
-
44
-
45
-
46
-
47
-
48
-
49
-
50
-
51
-
52
-
53
-
54
-
55
-
56
-
57
-
58
-
59
-
60
-
61
-
62
-
63
-
64
-
65
-
66
-
67
-
68
-
69
-
70
-
71
-
72
-
73
-
74
-
75
-
76
-
77
-
78
-
79
-
80
-
81
-
82
-
83
-
84
-
85
-
86
-
87
-
88
-
89
-
90
-
91
-
92
-
93
-
94
-
95
-
96
-
97
-
98
-
99
-
100
-
101
-
102
-
103
-
104
-
105
-
106
-
107
-
108
-
109
-
110
-
111
-
112
-
113
-
114
-
115
-
116
-
117
-
118
-
119
-
120
-
121
-
122
-
123
-
124
-
125
-
 126
126 -
 127
127 -
 128
128 -
 129
129 -
 130
130 -
 131
131 -
 132
132 -
 133
133 -
 134
134 -
 135
135 -
 136
136 -
 137
137 -
 138
138 -
 139
139 -
 140
140 -
 141
141 -
 142
142 -
 143
143 -
 144
144 -
 145
145 -
 146
146
 |
 |

Notes to Consolidated Financial Statements
International Business Machines Corporation and Subsidiary Companies
135
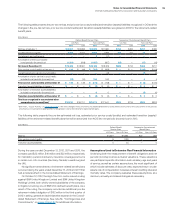
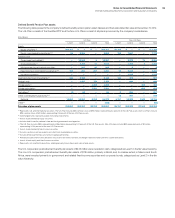
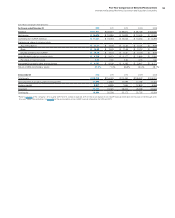
The following tables reflect the results of operations of the company’s segments consistent with the management and measurement system
utilized within the company. Performance measurement is based on pre-tax income. These results are used, in part, by senior management,
both in evaluating the performance of, and in allocating resources to, each of the segments.
Management System Segment View
($ in millions)
Global Services Segments
For the year ended December 31:
Global
Technology
Services
Global
Business
Services Software
Systems and
Technology
Global
Financing
Tota l
Segments
2012
External revenue $40,236 $18,566 $25,448 $ 17,667 $2,013 $103,930
Internal revenue 1,166 719 3,274 676 2,060 7,896
Total revenue $41,402 $19,286 $28,722 $18,343 $4,073 $111,826
Pre-tax income $ 6,961 $ 2,983 $10,810 $ 1,227 $2,034 $ 24,015
Revenue year-to-year change (1.7)% (4.0)% 1.8% (7.5)% (2.9)% (2.3)%
Pre-tax income year-to-year change 10.8% (0.8)% 8.4% (24.9)% 1.1% 4.8%
Pre-tax income margin 16.8% 15.5% 37.6% 6.7% 49.9% 21.5%
2011
External revenue $40,879 $19,284 $24,944 $ 18,985 $2,102 $106,194
Internal revenue 1,242 797 3,276 838 2,092 8,246
Total revenue $42,121 $20,081 $28,219 $19,823 $4,195 $114,440
Pre-tax income $ 6,284 $ 3,006 $ 9,970 $ 1,633 $2,011 $ 22,904
Revenue year-to-year change 6.6% 5.6% 10.9% 5.6% 2.8% 7.1%
Pre-tax income year-to-year change 14.3% 18.1% 5.3% 12.2% 2.8% 9.5%
Pre-tax income margin 14.9% 15.0% 35.3% 8.2% 47.9% 20.0%
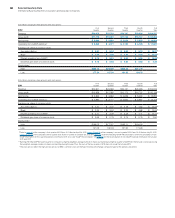
2010
External revenue $38,201 $18,223 $22,485 $ 17,973 $2,238 $ 99,120
Internal revenue 1,313 798 2,950 804 1,842 7,707
Total revenue $39,514 $19,021 $25,436 $18,777 $4,080 $106,827
Pre-tax income $ 5,499 $ 2,546 $ 9,466 $ 1,456 $1,956 $ 20,923
Revenue year-to-year change 2.0% 2.6% 5.7% 9.8% 0.1% 4.2%
Pre-tax income year-to-year change 0.3% 1.8% 13.8% 12.1% 13.5% 8.3%
Pre-tax income margin 13.9% 13.4% 37.2% 7.8% 48.0% 19.6%