IBM 2012 Annual Report Download - page 37
Download and view the complete annual report
Please find page 37 of the 2012 IBM annual report below. You can navigate through the pages in the report by either clicking on the pages listed below, or by using the keyword search tool below to find specific information within the annual report.-
 1
1 -
2
-
3
-
4
-
5
-
6
-
7
-
8
-
9
-
10
-
11
-
12
-
13
-
14
-
15
-
16
-
17
-
18
-
19
-
20
-
21
-
22
-
23
-
24
-
25
-
26
-
 27
27 -
 28
28 -
 29
29 -
 30
30 -
 31
31 -
 32
32 -
 33
33 -
 34
34 -
 35
35 -
 36
36 -
 37
37 -
 38
38 -
 39
39 -
 40
40 -
 41
41 -
 42
42 -
 43
43 -
 44
44 -
 45
45 -
 46
46 -
 47
47 -
48
-
49
-
50
-
51
-
52
-
53
-
54
-
55
-
56
-
57
-
58
-
59
-
60
-
61
-
62
-
63
-
64
-
65
-
66
-
67
-
68
-
69
-
70
-
71
-
72
-
73
-
74
-
75
-
76
-
77
-
78
-
79
-
80
-
81
-
82
-
83
-
84
-
85
-
86
-
87
-
88
-
89
-
90
-
91
-
92
-
93
-
94
-
95
-
96
-
97
-
98
-
99
-
100
-
101
-
102
-
103
-
104
-
105
-
106
-
107
-
108
-
109
-
110
-
111
-
112
-
113
-
114
-
115
-
116
-
117
-
118
-
119
-
120
-
121
-
122
-
123
-
124
-
125
-
126
-
127
-
128
-
129
-
130
-
131
-
132
-
133
-
134
-
135
-
136
-
137
-
138
-
139
-
140
-
141
-
142
-
143
-
144
-
145
-
146
 |
 |

3636 Management Discussion
International Business Machines Corporation and Subsidiary Companies
The assets and debt associated with the Global Financing busi-
ness are a significant part of the company’s financial position. The
financial position amounts appearing on page 72 are the consoli-
dated amounts including Global Financing. The amounts appearing
in the separate Global Financing section, beginning on page 63, are
supplementary data presented to facilitate an understanding of the
Global Financing business.
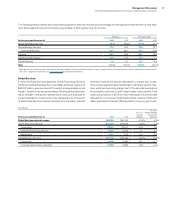
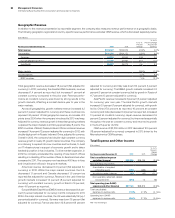
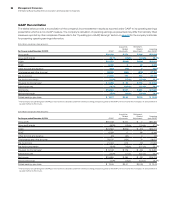
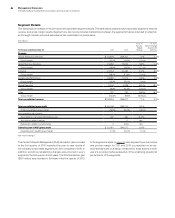
Working Capital
($ in millions)
At December 31: 2012 2011
Current assets $49,433 $50,928
Current liabilities 43,625 42,123
Working capital $ 5,807 $ 8,805
Current ratio 1.13:1 1.21:1
Working capital decreased $2,998 million from the year-end 2011
position. The key changes are described below:
Current assets decreased $1,496 million ($1,212 million adjusted
for currency) due to:
• A decrease of $1,224 million in prepaid expenses and other
current assets due to:
– A decrease of $610 million related to derivatives;
$398 million in cash collateral received, and $213 million
primarily related to currency rate volatility; and
– A decrease of $614 million in various prepaid expenses
(taxes, maintenance, insurance, deposits)
• A decline of $794 million ($661 million adjusted for currency)
in cash and cash equivalents, and marketable securities
(see cash flow analysis in the following column); and
• A decrease of $308 million in inventory, primarily in Systems
and Technology; partially offset by
• An increase of $1,016 million ($1,047 million adjusted for
currency) in short-term receivables primarily attributable
to higher volumes of financing receivables driven by
customer loans and inventory financing.
Current liabilities increased $1,502 million ($1,682 million adjusted
for currency) as a result of:
• An increase of $1,635 million in taxes primarily due to the
reclassification of long-term tax liabilities to short term; and
• An increase of $719 million ($879 million adjusted for currency)
in short-term debt due to:
– Reclassifications of $5,638 million from long-term debt
and short-term additions of $4,541 million, offset by
– Maturities of approximately $8,792 million, and a decline
of approximately $500 million in commercial paper; partially
offset by
• A decrease of $565 million in accounts payable primarily
related to the obligation to return cash collateral received
related to derivative valuations.
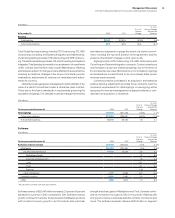
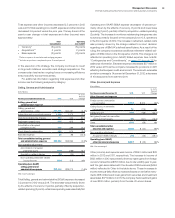
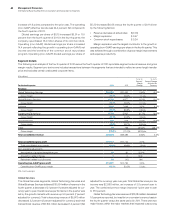
Cash Flow
The company’s cash flows from operating, investing and financing
activities, as reflected in the Consolidated Statement of Cash Flows
on page 73, is summarized in the table below. These amounts include
the cash flows associated with the Global Financing business.
($ in millions)
For the year ended December 31: 2012 2011
Net cash provided by/(used in)
Operating activities $ 19,586 $ 19,846
Investing activities (9,004) (4,396)
Financing activities (11,976) (13,696)
Effect of exchange rate changes
on cash and cash equivalents (116) (493)
Net change in cash and cash equivalents $ (1,511) $ 1,262
Net cash provided by operating activities decreased by $260 million
in 2012 as compared to 2011 driven by the following key factors:
• A decrease in cash due to receivables of $1,290 million
(normalized for a $339 million tax refund received in 2012),
as a result of higher volumes in 2012;
• A decrease in vendor payables of $675 million;
• An increase in cash used for workforce rebalancing payments
of $236 million, primarily in the non-U.S.; and
• An increase in cash used for retirement-related plans
of $181 million driven by an increase in nonpension post-
retirement contributions, partially offset by
• Lower net tax payments of $999 million compared
to 2011;
• Improved net income of $749 million; and
• Lower cash requirements for inventory of $442 million.
Net cash used in investing activities increased $4,608 million primarily
driven by:
• A net increase of $1,325 million in net cash used for
acquisitions/divestitures; and
• A decrease in cash of $2,719 million from net purchases
of marketable securities and other investments.
Net cash used in financing activities decreased $1,719 million
primarily as a result of:
• A decrease of $2,137 million of net cash used for common
stock transactions; partially offset by
• An increase of $300 million in cash dividends paid.