IBM 2005 Annual Report Download - page 97
Download and view the complete annual report
Please find page 97 of the 2005 IBM annual report below. You can navigate through the pages in the report by either clicking on the pages listed below, or by using the keyword search tool below to find specific information within the annual report.-
 1
1 -
2
-
3
-
4
-
5
-
6
-
7
-
8
-
9
-
10
-
11
-
12
-
13
-
14
-
15
-
16
-
17
-
18
-
19
-
20
-
21
-
22
-
23
-
24
-
25
-
26
-
27
-
28
-
29
-
30
-
31
-
32
-
33
-
34
-
35
-
36
-
37
-
38
-
39
-
40
-
41
-
42
-
43
-
44
-
45
-
46
-
47
-
48
-
49
-
50
-
51
-
52
-
53
-
54
-
55
-
56
-
57
-
58
-
59
-
60
-
61
-
62
-
63
-
64
-
65
-
66
-
67
-
68
-
69
-
70
-
71
-
72
-
73
-
74
-
75
-
76
-
77
-
78
-
79
-
80
-
81
-
82
-
83
-
84
-
85
-
86
-
 87
87 -
 88
88 -
 89
89 -
 90
90 -
 91
91 -
 92
92 -
 93
93 -
 94
94 -
 95
95 -
 96
96 -
 97
97 -
 98
98 -
 99
99 -
 100
100 -
 101
101 -
 102
102 -
 103
103 -
 104
104 -
 105
105
 |
 |

NotestoConsolidatedFinancialStatements
INTERNATIONALBUSINESSMACHINESCORPORATION ANDSUBSIDIARYCOMPANIES
96_ NotestoConsolidatedFinancialStatements
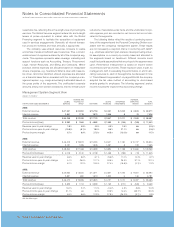
reasonablefee,reflectingthearm’s-lengthvalueofprovidingthe
services.TheGlobalServicessegmententersintoarm’s-length
leases at prices equivalent to market rates with the Global
Financing segment to facilitate the acquisition of equipment
used in services engagements. Generally, all internal transac-
tionpricesarereviewedandresetannually,ifappropriate.
The company uses shared resources concepts to realize
economiesofscaleandefficientuseofresources.Thus,aconsid-
erableamountofexpenseissharedbyallofthecompany’sseg-
ments.Thisexpenserepresentssalescoverage,marketingand
support functions such as Accounting, Treasury, Procurement,
Legal, Human Resources, and Billing and Collections. Where
practical,sharedexpensesareallocatedbased on measurable
driversofexpense,e.g.,headcount. Whenaclearandmeasura-
bledrivercannotbeidentified,sharedexpensesareallocated
onafinancialbasisthatisconsistentwiththecompany’sman-
agementsystem;e.g.,imageadvertisingisallocatedbasedon
the gross profits of the segments. The unallocated corporate
amountsarisingfromcertain divestitures,indirectinfrastructure
reductions, miscellaneoustaxitemsandtheunallocatedcorpo-
rateexpensepoolarerecordedinnetincomebutarenotallo-
catedtothesegments.
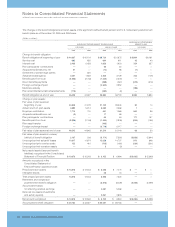
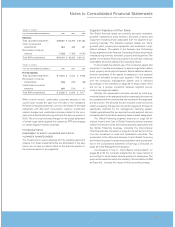
The following tables reflect the results of continuing opera-
tionsofthesegmentsand the PersonalComputingDivision con-
sistent with the company’s management system. These results
are not necessarily a depiction that is in conformity with GAAP;
e.g.,employeeretirementplancostsaredevelopedusingactuar-
ial assumptions on a country-by-country basis and allocated to
the segments based on headcount. Different amounts could
resultifactuarialassumptionsthatareuniquetothesegmentwere
used. Performance measurement is based on income before
incometaxes(pre-taxincome).Theseresultsareused,inpart,by
management,bothinevaluatingtheperformanceof,andinallo-
catingresourcesto,eachofthesegments.Asdiscussedinnote
U,“Stock-BasedCompensation” onpages83to85,thecompany
adopted the fair value method of accounting for stock-based
awards granted to employees. The following segments’ pre-tax
incomeincludestheimpactofthisaccountingchange.
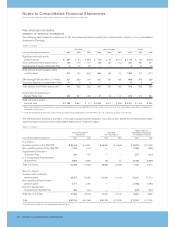
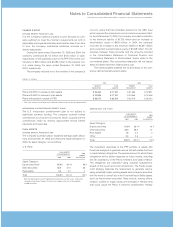
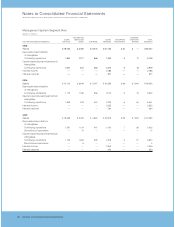
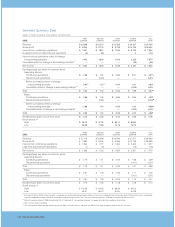
ManagementSystemSegmentView
(Dollarsinmillions)
SYSTEMSAND PERSONAL
GLOBAL TECHNOLOGY GLOBAL ENTERPRISE COMPUTING TOTAL
FORTHEYEARENDEDDECEMBER31: SERVICES GROUP SOFTWARE FINANCING INVESTMENTS DIVISION SEGMENTS
2005:
Externalrevenue $«47,357 $«20,981 $«15,753 $«2,401 $«1,203 $«««2,876 $«««90,571
Internalrevenue 2,891 1,118 1,970 1,506 8 33 7,526
Totalrevenue $«50,248 $«22,099 $«17,723 $«3,907 $«1,211 $«««2,909 $«««98,097
Pre-taxincome/(loss) $«««3,382 $«««1,966 $«««4,882 $«1,583 $«««(145) $«««««(165) $«««11,503
Revenueyear-to-yearchange 1.8% 4.9% 4.9% 0.3% 1.9% NM (5.0) %
Pre-taxincomeyear-to-yearchange (15.8) % (8.1) % 18.0% 8.6% 27.1% NM (0.4) %
Pre-taxincomemargin 6.7% 8.9% 27.5% 40.5% (12.0) % NM 11.7%
2004:
Externalrevenue $«46,213 $«19,973 $«15,094 $«2,607 $«1,180 $«10,737 $«««95,804
Internalrevenue 3,131 1,095 1,805 1,287 8 129 7,455
Totalrevenue $«49,344 $«21,068 $«16,899 $«3,894 $«1,188 $«10,866 $«103,259
Pre-taxincome/(loss) $«««4,018 $«««2,140 $«««4,138 $«1,458 $«««(199) $«««««««(10) $«««11,545
Revenueyear-to-yearchange 8.5% 8.6% 6.1% (5.6) % 11.0% 14.4% 8.1%
Pre-taxincomeyear-to-yearchange 5.1% 25.6% 21.7% 26.6% 26.3% 97.1% 22.1%
Pre-taxincomemargin 8.1% 10.2% 24.5% 37.4% (16.8) % (0.1) % 11.2%
2003:
Externalrevenue $«42,635 $«18,505 $«14,311 $«2,827 $«1,065 $«««9,351 $«««88,694
Internalrevenue 2,837 890 1,613 1,300 5 146 6,791
Totalrevenue $«45,472 $«19,395 $«15,924 $«4,127 $«1,070 $«««9,497 $«««95,485
Pre-taxincome/(loss) $«««3,823 $«««1,704 $«««3,399 $«1,152 $«««(270) $«««««(349) $«««««9,459
Revenueyear-to-yearchange 16.0% 2.4% 11.4% (0.4) % 4.3% 3.8% 10.0%
Pre-taxincomeyear-to-yearchange 31.1% NM 9.4% 24.8% 14.6% (53.7) % 39.4%
Pre-taxincomemargin 8.4% 8.8% 21.3% 27.9% (25.2) % (3.7) % 9.9%
NM—NotMeaningful