IBM 2005 Annual Report Download - page 35
Download and view the complete annual report
Please find page 35 of the 2005 IBM annual report below. You can navigate through the pages in the report by either clicking on the pages listed below, or by using the keyword search tool below to find specific information within the annual report.-
 1
1 -
2
-
3
-
4
-
5
-
6
-
7
-
8
-
9
-
10
-
11
-
12
-
13
-
14
-
15
-
16
-
17
-
18
-
19
-
20
-
21
-
22
-
23
-
24
-
 25
25 -
 26
26 -
 27
27 -
 28
28 -
 29
29 -
 30
30 -
 31
31 -
 32
32 -
 33
33 -
 34
34 -
 35
35 -
 36
36 -
 37
37 -
 38
38 -
 39
39 -
 40
40 -
 41
41 -
 42
42 -
 43
43 -
 44
44 -
 45
45 -
46
-
47
-
48
-
49
-
50
-
51
-
52
-
53
-
54
-
55
-
56
-
57
-
58
-
59
-
60
-
61
-
62
-
63
-
64
-
65
-
66
-
67
-
68
-
69
-
70
-
71
-
72
-
73
-
74
-
75
-
76
-
77
-
78
-
79
-
80
-
81
-
82
-
83
-
84
-
85
-
86
-
87
-
88
-
89
-
90
-
91
-
92
-
93
-
94
-
95
-
96
-
97
-
98
-
99
-
100
-
101
-
102
-
103
-
104
-
105
 |
 |

ManagementDiscussion
INTERNATIONALBUSINESSMACHINESCORPORATION ANDSUBSIDIARYCOMPANIES
34_ ManagementDiscussion
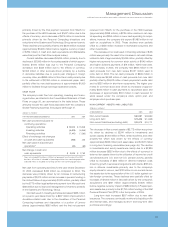
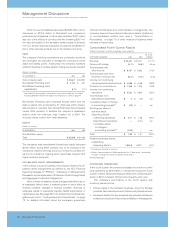
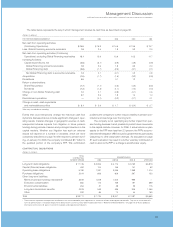
PriorYearinReview
(Dollars andshares inmillionsexceptpershareamounts)
YR. TOYR.
FOR THEYEARENDEDDECEMBER31: 2004 2003 CHANGE
Revenue $«««96,293 $«««89,131 8.0% *
Grossprofitmargin «36.9% «36.5% 0.4 pts.
Totalexpenseand
otherincome $«««24,900 $«««23,130 7.7%
Totalexpenseandother
income-to-revenueratio 25.9% 26.0% (0.1) %
Incomefromcontinuing
operationsbefore
incometaxes $«««10,669 $«««««9,417 13.3%
Provisionforincometaxes $«««««3,172 $«««««2,829 12.1%
Incomefromcontinuing
operations $«««««7,497 $«««««6,588 13.8%
Lossfromdiscontinued
operations $««««««««««18 $««««««««««30 (41.3) %
Earningspershare of
commonstock:
Assumingdilution:
Continuingoperations $«««««««4.39 $«««««««3.76 16.8%
Discontinuedoperations ««««««(0.01) ««««««(0.02) (39.8) %
Total $«««««««4.38 $«««««««3.74 17.1%
Weighted-averageshares
outstanding:
Assumingdilution 1,707.2 1,752.8 (2.6) %
Assets** $«111,003 $«106,021 4.7%
Liabilities** $«««79,315 $«««76,490 3.7%
Equity** $«««31,688 $«««29,531 7.3%
* 3.4percent adjusted for currency.
** AtDecember31
of the economy and continued market share gains for
zSeries, xSeries and pSeries server products, as well as
increasedrevenueforpersonalcomputers
• Continued demand growth in emerging countries (up over
25percent)andinBPTS(upapproximately45percent)
• Favorableimpactofcurrencytranslation
Revenuefromallindustrysectorsincreasedin2004whencom-
paredto2003,reflectingthecompany’sbroadcapabilitiesand
industry-specificsolutionswhichcombinetechnologyandhigh-
valueservicestosolveaclient’sbusinessorITproblems.These
solutions also provide for a longer-term relationship with the
client, rather than a transaction-oriented sale. The Financial
Services sector revenue growth of 9.3 percent was led
by Financial Markets (15 percent), Banking (9 percent) and
Insurance(8percent).TheCommunicationssectorhadrevenue
growth of10.4 percent with growth in Telecommunications (15
percent), while the Distribution sector revenue growth was 7.5
percent, led by the Retail Industry (12 percent). The Small &
Mediumbusinesssectorrevenueincreased8.3percentasthe
companycontinuedtorolloutnewproductsundertheExpress
labelthataredesignedandpricedspecificallyfor clients inthe
100to1,000employeesegment.
Revenue across all geographies increased in 2004 when
compared to 2003. In the Americas, U.S. (6 percent) and
Canada(9percent)revenuegrewasdidLatinAmerica(12per-
cent),notablyBrazil,whichgrewat15percent.
Within Europe/Middle East/Africa, Eastern Europe, the
Nordiccountries,Spain(7percent)andFrance(3percent)had
revenuegrowth,whiletheU.K.(2percent),Germany(3percent)
andItaly(8percent)declined whenadjusted forcurrency.Asia
Pacifichadstronggrowthin2004,ledbyChina,whichgrewat
25 percent, and the ASEAN region (17 percent), while Japan,
which is about 60 percent of Asia Pacific’s revenue, also had
growth of 5 percent. Collectively, as a result of the company’s
targetedinvestments,theemergingcountriesofChina,Russia
(75percent),India(45percent)andBrazilhadrevenuegrowth
over25percentin2004toover$4.0billioninrevenue.
OEMrevenueincreasedin2004versus2003dueprimarily
to continued strong growth in the company’s E&TS business
and improved operational performance in the Microelectron-
icsbusiness.
Thefollowingisananalysisofexternalsegmentresults.
GLOBAL SERVICES
Global Services revenue increased 8.4 percent (3.1 percent
adjustedforcurrency).SOrevenuegrew 12.8 percentandcon-
tinuedtodemonstrateitscompetitiveadvantageindeliveringon
demand solutions by leveraging both its business transforma-
tionalskills and scale during2004.Eachgeography continued
year-to-yeargrowth,withsevenconsecutivequartersofdouble-
digit growth in Europe/Middle East/Africa, excluding currency
benefits.WithinSO,e-businessHostingServices,anofferingthat
providesWebinfrastructureandapplicationmanagementasan
Internet-basedservice,continueditspatternofrevenuegrowth.
ITSrevenue,whichexcludesMaintenance,increased4.8percent
ContinuingOperations
In2004,thecompanydemonstratedthatitcouldextenditslead-
ershipinagrowthenvironment.Thecompanydeliveredrevenue
growthof8.0percentanddilutedearningspersharegrowthof
16.8percent.Theincreaseinthecompany’sIncomefromcontin-
uingoperationsanddilutedearningspersharefromcontinuing
operationsascomparedto2003wasprimarilydueto:
• Improvingdemandassociatedwiththemoderateexpansion
oftheeconomyandcontinuedmarketsharegainsforzSeries
andxSeriesserverproducts
• Continued operational improvements in the Microelec-
tronicsbusiness
• Continueddemandgrowthinemergingcountries
• Favorableimpactofcurrencytranslation
Theincreaseinrevenuein2004ascomparedto2003waspri-
marilydueto:
• ImproveddemandinGlobalServicesandkeyindustrysectors
• Improvingdemandassociatedwiththemoderateexpansion