IBM 2005 Annual Report Download - page 40
Download and view the complete annual report
Please find page 40 of the 2005 IBM annual report below. You can navigate through the pages in the report by either clicking on the pages listed below, or by using the keyword search tool below to find specific information within the annual report.-
 1
1 -
2
-
3
-
4
-
5
-
6
-
7
-
8
-
9
-
10
-
11
-
12
-
13
-
14
-
15
-
16
-
17
-
18
-
19
-
20
-
21
-
22
-
23
-
24
-
25
-
26
-
27
-
28
-
29
-
 30
30 -
 31
31 -
 32
32 -
 33
33 -
 34
34 -
 35
35 -
 36
36 -
 37
37 -
 38
38 -
 39
39 -
 40
40 -
 41
41 -
 42
42 -
 43
43 -
 44
44 -
 45
45 -
 46
46 -
 47
47 -
 48
48 -
 49
49 -
 50
50 -
51
-
52
-
53
-
54
-
55
-
56
-
57
-
58
-
59
-
60
-
61
-
62
-
63
-
64
-
65
-
66
-
67
-
68
-
69
-
70
-
71
-
72
-
73
-
74
-
75
-
76
-
77
-
78
-
79
-
80
-
81
-
82
-
83
-
84
-
85
-
86
-
87
-
88
-
89
-
90
-
91
-
92
-
93
-
94
-
95
-
96
-
97
-
98
-
99
-
100
-
101
-
102
-
103
-
104
-
105
 |
 |

ManagementDiscussion
INTERNATIONALBUSINESSMACHINESCORPORATION ANDSUBSIDIARYCOMPANIES
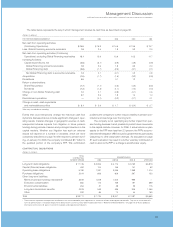
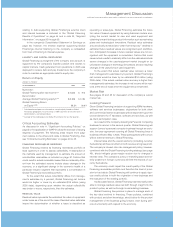
Thetablebelowrepresentsthewayinwhichmanagementreviewsitscashflowasdescribed onpage38.
(Dollarsinbillions)
FORTHEYEARENDEDDECEMBER31: 2005 2004 2003 2002 2001
Netcashfromoperatingactivities
(ContinuingOperations): $«14.9 $«15.3 $«14.5 $«13.8 $«13.7
Less: GlobalFinancingaccountsreceivable 1.8 2.5 1.9 3.3 2.0
Netcashfromoperatingactivities(Continuing
Operations),excludingGlobalFinancingreceivables 13.1 12.9 12.6 10.5 11.7
InvestingActivities:
Capitalexpenditures,net (3.5) (3.7) (3.9) (4.6) (4.9)
GlobalFinancingaccountsreceivable 1.8 2.5 1.9 3.3 2.0
GlobalFinancingdebt (0.6) (1.7) (2.6) (3.1) (1.1)
NetGlobalFinancingdebt toaccountsreceivable 1.3 0.7 (0.7) 0.2 0.9
Acquisitions (1.5) «(1.7) (1.8) (3.2) (0.9)
Divestitures 0.9 — 0.1 1.2 —
Returntoshareholders:
ShareRepurchase ««(7.7) «(7.1) «««(4.3) ««(4.2) «««(5.3)
Dividends (1.2) (1.2) (1.1) (1.0) (1.0)
Changeinnon-GlobalFinancingdebt 1.2 0.7 (0.9) (0.1) 0.6
Other ««0.7 «2.5 «««1.9 ««1.4 «««1.4
Discontinuedoperations —(0.1) (0.2) (0.7) 0.1
Changeincash, cashequivalents
andmarketablesecurities ««$«««3.1 «$«««2.9 «««$«««1.7 ««$««(0.4) «««$«««2.7
Tablemaynotaddduetorounding.
Events that could temporarily change the historical cash flow
dynamicsdiscussed above include significantchangesinoper-
atingresults,material changes ingeographic sources of cash,
unexpected adverse impacts from litigation or future pension
fundingduringperiodsofsevereandprolongeddownturninthe
capital markets. Whether any litigation has such an adverse
impact will depend on a number of variables, which are more
completelydescribedonpage 78.Withrespecttopensionfund-
ing,onJanuary19,2005, thecompanycontributed$1.7billionto
the qualified portion of the company’s PPP. This contribution
positionsthecompanytofurtherreducevolatilityinpensioncon-
tributionsandearningsoverthelongterm.
Thecompany isnotquantifyinganyfurtherimpactfrompen-
sionfundingbecauseitisnotpossibletopredictfuturemovements
inthecapitalmarkets.However,for 2006,ifactualreturnsonplan
assetsforthePPPwerelessthan 2.3 percent,thePPP’saccumu-
latedbenefitobligation(ABO)wouldbegreaterthanitsplanassets
(assuming no other assumption change). As discussed on page
87,suchasituationmayresultinafurthervoluntarycontributionof
cashorstocktothePPPorachargetostockholders’ equity.
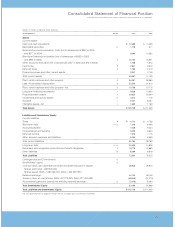
CONTRACTUAL OBLIGATIONS
(Dollarsinmillions)
TOTAL
CONTRACTUAL PAYMENTSDUEIN
PAYMENTSTREAM 2006 2007-08 2009-10 AFTER2010
Long-termdebtobligations $«17,745 $«2,906 $«4,174 $«3,752 $«6,913
Capital(finance)leaseobligations 452 104 155 141 52
Operatingleaseobligations 5,780 1,331 2,066 1,369 1,014
Purchaseobligations 2,104 809 906 267 122
Otherlong-termliabilities:
Minimumpensionfunding(mandated)* 3,816 1,818 1,002 996 —
Executivecompensation 850 115 169 197 369
Environmentalliabilities 254 27 29 23 175
Long-termterminationbenefits 2,378 549 436 308 1,085
Other 332 65 70 44 153
Total $«33,711 $«7,724 $«9,007 $«7,097 $«9,883
* Theseamountsrepresentfuturepensioncontributionsthataremandatedbylocalregulationsorstatuteforretireesreceivingpensionbenefits.Theyareallassociatedwith
non-U.S.pensionplans.Theprojectedpaymentsbeyond2010 arenotcurrentlydeterminable.Seenote V,“Retirement-RelatedBenefits,”onpages 85to95 foradditional
informationonthenon-U.S.plans’investmentstrategiesandexpectedcontributions.
_39