IBM 2005 Annual Report Download - page 33
Download and view the complete annual report
Please find page 33 of the 2005 IBM annual report below. You can navigate through the pages in the report by either clicking on the pages listed below, or by using the keyword search tool below to find specific information within the annual report.-
 1
1 -
2
-
3
-
4
-
5
-
6
-
7
-
8
-
9
-
10
-
11
-
12
-
13
-
14
-
15
-
16
-
17
-
18
-
19
-
20
-
21
-
22
-
 23
23 -
 24
24 -
 25
25 -
 26
26 -
 27
27 -
 28
28 -
 29
29 -
 30
30 -
 31
31 -
 32
32 -
 33
33 -
 34
34 -
 35
35 -
 36
36 -
 37
37 -
 38
38 -
 39
39 -
 40
40 -
 41
41 -
 42
42 -
 43
43 -
44
-
45
-
46
-
47
-
48
-
49
-
50
-
51
-
52
-
53
-
54
-
55
-
56
-
57
-
58
-
59
-
60
-
61
-
62
-
63
-
64
-
65
-
66
-
67
-
68
-
69
-
70
-
71
-
72
-
73
-
74
-
75
-
76
-
77
-
78
-
79
-
80
-
81
-
82
-
83
-
84
-
85
-
86
-
87
-
88
-
89
-
90
-
91
-
92
-
93
-
94
-
95
-
96
-
97
-
98
-
99
-
100
-
101
-
102
-
103
-
104
-
105
 |
 |

ManagementDiscussion
INTERNATIONALBUSINESSMACHINESCORPORATION ANDSUBSIDIARYCOMPANIES
32_ ManagementDiscussion
Othernon-currentliabilitiesdecreased$2,628milliondueto
decreases of $2,104 million in Retirement and nonpension
postretirementobligationsofwhichapproximately$1,137 million
wasduetotheeffects ofcurrencyandtheremaining$967 mil-
lionwasattributabletothe favorablefundedstatusofprimarily
non-U.S. pensionplansasdiscussedon page93;and$524mil-
lioninotheraccrualsprimarilyduetotheeffectsofcurrency.
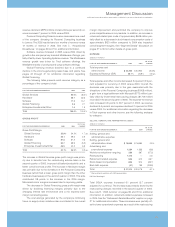
DEBT
Thecompany’sfundingrequirementsarecontinuallymonitored
andstrategiesareexecutedtomanage the company’soverall
asset and liability profile. Additionally, the company maintains
sufficientflexibilitytoaccessglobalfundingsourcesasneeded.
(Dollarsinmillions)
ATDECEMBER31: 2005 2004
Totalcompanydebt $«22,641 $«22,927
Non-GlobalFinancingdebt* $«««2,142 $««««««607
Non-GlobalFinancingdebt/
capitalization 6.7% 2.1%
* Non-GlobalFinancingdebtisthecompany’stotalexternaldebtlesstheGlobal
FinancingdebtdescribedintheGlobalFinancingbalancesheetonpage 44.
Non-Global Financing debt increased $1,535 million and the
debt-to-capitalratio at December31, 2005 was within accept-
ablelevelsat 6.7 percent.Non-GlobalFinancingdebtincreased
versus 2004 primarily to facilitate the company’s repatriation
actions under the American Jobs Creation Act of 2004. The
increaserelatesto short-termdebtissuances.
EQUITY
(Dollarsinmillions)
ATDECEMBER31: 2005 2004
Stockholders’equity:
Total $«33,098 $«31,688
Thecompany’stotalconsolidatedStockholders’ equityincreased
$1,410 million during 2005 primarily due to an increase in the
company’sretainedearningsdrivenbynetincome,partiallyoff-
setby the company’songoingstockrepurchaseprogram and
higherdividendpayments.
OFF-BALANCE SHEET ARRANGEMENTS
In theordinarycourseofbusiness, thecompanyenteredintooff-
balance sheet arrangements as defined by the SEC Financial
Reporting Release 67 (FRR-67), “Disclosure in Management’s
DiscussionandAnalysisaboutOff-BalanceSheetArrangements
andAggregateContractualObligations.”
Noneoftheseoff-balancesheetarrangementseitherhas,or
isreasonablylikely to have,a material currentorfutureeffecton
financial condition, changes in financial condition, revenues or
expenses, results of operations, liquidity, capital expenditures or
capitalresources.Seepage 39 forthecompany’scontractualobli-
gations and note O,“ContingenciesandCommitments,” onpage
78, for detailed information about the company’s guarantees,
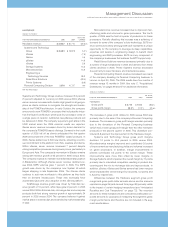
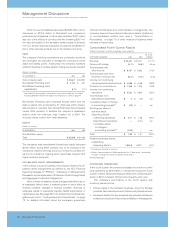
ConsolidatedFourth-QuarterResults
(Dollars andshares inmillionsexceptpershareamounts)
YR. TOYR.
FORFOURTHQUARTER: 2005 2004 CHANGE
Revenue $«24,427 $«27,671 (11.7) % *
Grossprofitmargin «44.1% «38.8% 5.3 pts.
Totalexpenseand
otherincome $«««6,197 $«««6,690 (7.4) %
Totalexpenseandother
income-to-revenueratio 25.4% 24.2% 1.2 pts.
Incomefromcontinuing
operationsbefore incometaxes $«««4,568 $«««4,048 12.8%%
Provisionforincometaxes $«««1,348 $«««1,206 11.6%%
Incomefromcontinuing
operations $«««3,220 $«««2,842 13.3%
Income/(loss)from
discontinuedoperations $««««««««««3 $«««««««(15) NM
Cumulativeeffectofchange
inaccountingprinciple** $«««««««(36) $««««««««— NM
Earningspershareof
commonstock:
Assumingdilution:
Continuingoperations $«««««2.01 $«««««1.68 19.6%
Discontinuedoperations ««««««««— «« (0.01) NM
Cumulativeeffect
ofchangein
accountingprinciple** «««(0.02) «««««««— NM
Total $«««««1.99 $«««««1.67 19.2%
Weighted-averageshares
outstanding:
Assumingdilution 1,604.8 1,692.1 (5.2) %
* (8.5)percentadjustedforcurrency.
** Reflects implementationofFASBInterpretationNo.47.Seenote B,“Accounting
Changes,”onpages61 and62 foradditionalinformation.
NM—NotMeaningful
CONTINUING OPERATIONS
Inthefourthquarter,thecompanyincreasedIncomefromcontin-
uingoperationsby$378millionor13.3percentversusthefourth
quarterof2004.Dilutedearningspersharefromcontinuingoper-
ationsof$2.01 increased19.6percentversustheprioryear.
The company’s performance in the fourth quarter was
drivenbyseveralfactors:
• Strongresultsinthehardwarebusiness, driven by Storage
products,Microelectronicsand zSeriesandpSeriesservers.
• Increaseddemandforthecompany’skeybrandedmiddleware
softwareproductsandimprovedprofitabilityinthatsegment.
financialcommitments and indemnification arrangements. The
companydoesnothaveretainedinterestsinassetstransferred
to unconsolidated entities (see note J, “Securitization of
Receivables,” on page 70) or other material off-balance sheet
interestsorinstruments.