IBM 2005 Annual Report Download - page 6
Download and view the complete annual report
Please find page 6 of the 2005 IBM annual report below. You can navigate through the pages in the report by either clicking on the pages listed below, or by using the keyword search tool below to find specific information within the annual report.-
 1
1 -
 2
2 -
 3
3 -
 4
4 -
 5
5 -
 6
6 -
 7
7 -
 8
8 -
 9
9 -
 10
10 -
 11
11 -
 12
12 -
 13
13 -
 14
14 -
 15
15 -
 16
16 -
 17
17 -
18
-
19
-
20
-
21
-
22
-
23
-
24
-
25
-
26
-
27
-
28
-
29
-
30
-
31
-
32
-
33
-
34
-
35
-
36
-
37
-
38
-
39
-
40
-
41
-
42
-
43
-
44
-
45
-
46
-
47
-
48
-
49
-
50
-
51
-
52
-
53
-
54
-
55
-
56
-
57
-
58
-
59
-
60
-
61
-
62
-
63
-
64
-
65
-
66
-
67
-
68
-
69
-
70
-
71
-
72
-
73
-
74
-
75
-
76
-
77
-
78
-
79
-
80
-
81
-
82
-
83
-
84
-
85
-
86
-
87
-
88
-
89
-
90
-
91
-
92
-
93
-
94
-
95
-
96
-
97
-
98
-
99
-
100
-
101
-
102
-
103
-
104
-
105
 |
 |

TRANSACTIONAL ANNUITY
COMMODITY
TRANSACTIONAL ANNUITY
COMMODITY
SOLUTIONS
SOLUTIONS
POINT
PRODUCTS
POINT
PRODUCTS
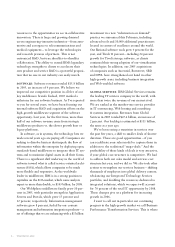
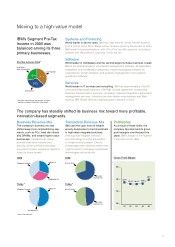
IBM’s Segment Pre-Tax
Income in 2005 was
balanced among its three
primary businesses.
_5
Business Revenue Mix
The company’s business mix has
shifted away from commoditizing seg-
ments, such as PCs, hard disk drives
and DRAMs, and toward higher value
businesses:
transactional
, which
provide near-term income; and
annuity
, which provide predictable,
long-term income, supplying capital to
invest in future growth.
Transaction Revenue Mix
IBM uses the cash from its reliable
annuity businesses to fund investment
in high-value integrated solutions:
offerings that integrate services
and technology to solve a business
or infrastructure problem. Clients
increasingly seek solutions rather than
“point-product” purchases of particular
technologies and products.
Profitability
As a result of these shifts, the
company has improved its gross
profit margins over the past five
years. IBM’s margin is the highest
it has been since 1996.
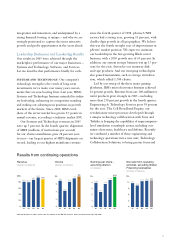
The company has steadily shifted its business mix toward more profitable,
innovation-based segments.
1996
Today*
* Post PC divestiture
* Excludes 2Q restructuring charges and PCs.
Software includes Enterprise Investments.
1996
Today*
Moving to a high-value model
01 02 03 04 05
37.9% 36.6% 36.5% 36.9%
40.1%
30%_
40%_
50%_
20%_
Systems and Financing
World leader in server sales. IBM has improved its server market position
by 9.5points since 2000. Blade server revenue grew by 65 percent in 2005.
IBM leads in supercomputers, with 219 of the top 500 systems —including
number one (BlueGene/L) and five of the top ten.
Software
World leader in middleware and the second-largest software business overall.
IBM is the market leader in information management software, all application
integration and middleware categories; instant messaging software for
corporations; portal software; and systems management and systems
operations software.
Services
World leader in IT services and consulting. IBM has approximately 198,000
services professionals globally. Offerings include datacenter outsourcing,
business transformation services, consulting, systems integration, application
management services, infrastructure and system maintenance and Web
hosting. IBM Global Services signings grew 9percent in 2005.
Pre-Tax Income 2005*
Gross Profit Margin
SYSTEMS
AND FINANCING
SOFTWARE
SERVICES
28% 37%
35%
01 02 03 04 05
37.9% 36.6% 36.5% 36.9%
40.1%
30%_
40%_
50%_
20%_