IBM 2005 Annual Report Download - page 102
Download and view the complete annual report
Please find page 102 of the 2005 IBM annual report below. You can navigate through the pages in the report by either clicking on the pages listed below, or by using the keyword search tool below to find specific information within the annual report.-
 1
1 -
2
-
3
-
4
-
5
-
6
-
7
-
8
-
9
-
10
-
11
-
12
-
13
-
14
-
15
-
16
-
17
-
18
-
19
-
20
-
21
-
22
-
23
-
24
-
25
-
26
-
27
-
28
-
29
-
30
-
31
-
32
-
33
-
34
-
35
-
36
-
37
-
38
-
39
-
40
-
41
-
42
-
43
-
44
-
45
-
46
-
47
-
48
-
49
-
50
-
51
-
52
-
53
-
54
-
55
-
56
-
57
-
58
-
59
-
60
-
61
-
62
-
63
-
64
-
65
-
66
-
67
-
68
-
69
-
70
-
71
-
72
-
73
-
74
-
75
-
76
-
77
-
78
-
79
-
80
-
81
-
82
-
83
-
84
-
85
-
86
-
87
-
88
-
89
-
90
-
91
-
 92
92 -
 93
93 -
 94
94 -
 95
95 -
 96
96 -
 97
97 -
 98
98 -
 99
99 -
 100
100 -
 101
101 -
 102
102 -
 103
103 -
 104
104 -
 105
105
 |
 |

_101_101
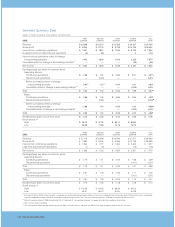
Five-YearComparisonofSelectedFinancialData
(Dollarsinmillionsexceptpershareamounts)
FORTHEYEAR: 2005 2004 2003 2002 2001
Revenue $«««91,134 $«««96,293 $«««89,131 $«81,186 $«83,067
Incomefromcontinuingoperations $«««««7,994 $«««««7,497 $«««««6,588 $«««4,156 $«««6,931
Loss fromdiscontinuedoperations (24) (18) (30) (1,780) (447)
Incomebeforecumulativeeffectofchange
inaccountingprinciple 7,970 7,479 6,558 2,376 6,484
Cumulativeeffectofchangein
accountingprinciple** (36) ————
Netincome $«««««7,934 $«««««7,479 $«««««6,558 $«««2,376 $«««6,484
Earnings/(loss)pershareofcommonstock:
Assumingdilution:
Continuingoperations $«««««««4.91 $«««««««4.39 $«««««««3.76 $«««««2.43 $«««««3.94
Discontinuedoperations (0.01) (0.01) (0.02) (1.04) (0.25)
Beforecumulativeeffectofchange
inaccountingprinciple 4.90 4.38 3.74 1.39 3.69
Cumulativeeffectofchange
inaccountingprinciple** (0.02) ————
Total $«««««««4.87* $«««««««4.38 $«««««««3.74 $«««««1.39 $«««««3.69
Basic:
Continuingoperations $«««««««4.99 $«««««««4.48 $«««««««3.83 $«««««2.44 $«««««3.99
Discontinuedoperations (0.02) (0.01) (0.02) (1.05) (0.26)
Beforecumulativeeffectofchange
inaccountingprinciple 4.98* 4.47 3.81 1.40* 3.74*
Cumulativeeffectofchange
inaccountingprinciple** (0.02) ————
Total $«««««««4.96 $«««««««4.47 $«««««««3.81 $«««««1.40 $«««««3.74
Cashdividendspaidoncommonstock $«««««1,250 $«««««1,174 $«««««1,085 $«««1,005 $««««««956
Pershareofcommonstock 0.78 0.70 0.63 0.59 0.55
Investmentinplant,rentalmachines
andotherproperty $«««««3,842 $«««««4,368 $«««««4,398 $«««5,022 $«««5,660
Returnonstockholders’equity 24.5% 24.4% 24.5% 9.8% 28.5%
ATENDOFYEAR: 2005 2004 2003 2002 2001
Totalassets $«105,748 $«111,003 $«106,021 $«97,814 $«91,207
Netinvestmentinplant,rentalmachines
andotherproperty 13,756 15,175 14,689 14,440 16,504
Workingcapital 10,509 7,357 7,205 6,927 7,483
Totaldebt 22,641 22,927 23,632 26,017 27,151
Stockholders’equity 33,098 31,688 29,531 24,112 24,352
* Doesnottotalduetorounding.
** ReflectsimplementationofFASBInterpretationNo.47.Seenote B,“AccountingChanges,” onpages61 and62 foradditionalinformation.