IBM 2005 Annual Report Download - page 69
Download and view the complete annual report
Please find page 69 of the 2005 IBM annual report below. You can navigate through the pages in the report by either clicking on the pages listed below, or by using the keyword search tool below to find specific information within the annual report.-
 1
1 -
2
-
3
-
4
-
5
-
6
-
7
-
8
-
9
-
10
-
11
-
12
-
13
-
14
-
15
-
16
-
17
-
18
-
19
-
20
-
21
-
22
-
23
-
24
-
25
-
26
-
27
-
28
-
29
-
30
-
31
-
32
-
33
-
34
-
35
-
36
-
37
-
38
-
39
-
40
-
41
-
42
-
43
-
44
-
45
-
46
-
47
-
48
-
49
-
50
-
51
-
52
-
53
-
54
-
55
-
56
-
57
-
58
-
 59
59 -
 60
60 -
 61
61 -
 62
62 -
 63
63 -
 64
64 -
 65
65 -
 66
66 -
 67
67 -
 68
68 -
 69
69 -
 70
70 -
 71
71 -
 72
72 -
 73
73 -
 74
74 -
 75
75 -
 76
76 -
 77
77 -
 78
78 -
 79
79 -
80
-
81
-
82
-
83
-
84
-
85
-
86
-
87
-
88
-
89
-
90
-
91
-
92
-
93
-
94
-
95
-
96
-
97
-
98
-
99
-
100
-
101
-
102
-
103
-
104
-
105
 |
 |

NotestoConsolidatedFinancialStatements
INTERNATIONALBUSINESSMACHINESCORPORATION ANDSUBSIDIARYCOMPANIES
68_ NotestoConsolidatedFinancialStatements
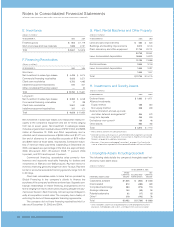
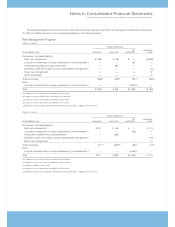
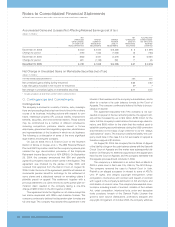
E.Inventories
(Dollarsinmillions)
ATDECEMBER31: 2005 2004
Finishedgoods $««««902 $«1,179
Workinprocessandrawmaterials 1,939 2,137
Total $«2,841 $«3,316
F. FinancingReceivables
(Dollarsinmillions)
ATDECEMBER31: 2005 2004
Short-term:
Netinvestmentinsales-typeleases $«««4,435 $«««5,074
Commercialfinancingreceivables 5,053 5,571
Client loan receivables 3,752 4,485
Installmentpaymentreceivables 510 641
Othernon-GlobalFinancingrelated —30
Total $«13,750 $«15,801
Long-term:
Netinvestmentinsales-typeleases $«««5,393 $«««6,049
Commercialfinancingreceivables 17 139
Client loan receivables 3,901 4,491
Installmentpaymentreceivables 317 271
Total $«««9,628 $«10,950
Netinvestmentinsales-typeleasesisforleasesthatrelateprin-
cipallytothe company’s equipment andare forterms ranging
from two to seven years. Net investment in sales-type leases
includesunguaranteedresidualvaluesof$792 millionand$836
million at December 31, 2005 and 2004, respectively, and is
reflectednetofunearnedincomeof$939 millionand$1,077mil-
lionand ofallowance for uncollectible accounts of$176 million
and$269 millionatthosedates,respectively.Scheduledmaturi-
ties of minimum lease payments outstanding at December 31,
2005,expressedasapercentageofthetotal,areapproximately:
2006, 48 percent; 2007, 28 percent; 2008, 17 percent; 2009,
5 percent;and2010 andbeyond,2percent.
Commercial financing receivables arise primarily from
inventory and accounts receivable financing for dealers and
remarketers of IBM and non-IBM products. Payment terms for
inventoryfinancinggenerallyrangefrom30to75days. Payment
termsforaccountsreceivablefinancinggenerallyrangefrom30
to90days.
Client loan receivablesrelateto loans that areprovidedby
Global Financing to the company’s clients to finance the
purchaseofthecompany’ssoftwareandservices. Separatecon-
tractual relationships on these financing arrangements are for
termsrangingfromtwoto seven yearsrequiringstraight-linepay-
mentsovertheterm.Eachfinancingcontractispricedindepend-
entlyatcompetitivemarketrates.Thecompanyhasahistoryof
enforcingthetermsoftheseseparatefinancingagreements.
The company did not have financing receivables held for
saleasofDecember31,2005and2004.
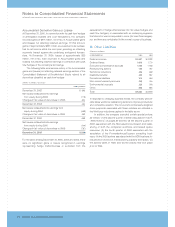
G.Plant,RentalMachinesandOtherProperty
(Dollarsinmillions)
ATDECEMBER31: 2005 2004
Landandlandimprovements $««««««684 $««««««840
Buildingsandbuildingimprovements 8,312 9,100
Plant,laboratoryandofficeequipment 21,760 22,701
30,756 32,641
Less:Accumulateddepreciation 18,600 18,973
12,156 13,668
Rentalmachines 3,505 3,744
Less:Accumulateddepreciation 1,905 2,237
1,600 1,507
Total $«13,756 $«15,175
H.InvestmentsandSundryAssets
(Dollarsinmillions)
ATDECEMBER31: 2005 2004*
Deferredtaxes $««1,832 $««4,671
Allianceinvestments:
Equitymethod 456 550
Non-equity method 558 309
Deferredtransition andset-up costs
andotherdeferredarrangements** 804 572
Long-termdeposits 200 209
Derivatives—non-current+160 48
Otherassets 964 756
Total $««4,974 $««7,115
* Reclassifiedtoconformwith2005presentation.
** Deferredtransition andset-up costs andotherdeferredarrangementsarerelated
toGlobalServicesclientarrangements.Alsoseenote A,“SignificantAccounting
Policies,”onpage 56 foradditionalinformation.
+ Seenote L,“DerivativesandHedgingTransactions,”onpages 71 to74 forthefair
valueofallderivativesreportedintheConsolidatedStatementofFinancialPosition.
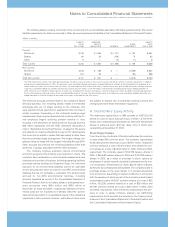
I.IntangibleAssetsIncludingGoodwill
Thefollowing table details thecompany’sintangibleassetbal-
ancesbymajorassetclass:
(Dollarsinmillions)
ATDECEMBER31,2005
GROSS NET
CARRYING ACCUMULATED CARRYING
INTANGIBLEASSETCLASS AMOUNT AMORTIZATION AMOUNT
Capitalized software $«1,805 $«««««(802) $«1,003
Client-related ««««910 «(490) «420
Completedtechnology 383 (270) 113
Strategicalliances 104 (68) 36
Patents/trademarks 32 (17) 15
Other* 218 (142) 76
Total $«3,452 $««(1,789) $«1,663
* Otherintangiblesareprimarilyacquiredproprietaryandnonproprietarybusiness
processes,methodologiesandsystems,andimpactsfromcurrencytranslation.