IBM 2005 Annual Report Download - page 31
Download and view the complete annual report
Please find page 31 of the 2005 IBM annual report below. You can navigate through the pages in the report by either clicking on the pages listed below, or by using the keyword search tool below to find specific information within the annual report.-
 1
1 -
2
-
3
-
4
-
5
-
6
-
7
-
8
-
9
-
10
-
11
-
12
-
13
-
14
-
15
-
16
-
17
-
18
-
19
-
20
-
 21
21 -
 22
22 -
 23
23 -
 24
24 -
 25
25 -
 26
26 -
 27
27 -
 28
28 -
 29
29 -
 30
30 -
 31
31 -
 32
32 -
 33
33 -
 34
34 -
 35
35 -
 36
36 -
 37
37 -
 38
38 -
 39
39 -
 40
40 -
 41
41 -
42
-
43
-
44
-
45
-
46
-
47
-
48
-
49
-
50
-
51
-
52
-
53
-
54
-
55
-
56
-
57
-
58
-
59
-
60
-
61
-
62
-
63
-
64
-
65
-
66
-
67
-
68
-
69
-
70
-
71
-
72
-
73
-
74
-
75
-
76
-
77
-
78
-
79
-
80
-
81
-
82
-
83
-
84
-
85
-
86
-
87
-
88
-
89
-
90
-
91
-
92
-
93
-
94
-
95
-
96
-
97
-
98
-
99
-
100
-
101
-
102
-
103
-
104
-
105
 |
 |

ManagementDiscussion
INTERNATIONALBUSINESSMACHINESCORPORATION ANDSUBSIDIARYCOMPANIES
30_ ManagementDiscussion
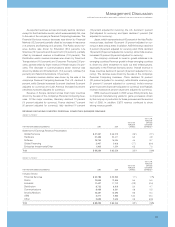
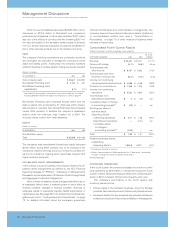
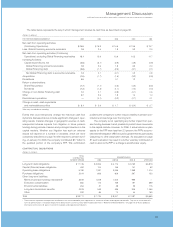
SOFTWARE
(Dollarsinmillions)
YR. TOYR.
FORTHEYEARENDEDDECEMBER31: 2005 2004* CHANGE
Softwarerevenue: $«15,753 $«15,094 4.4%
Middleware $«12,552 $«11,968 4.9%
WebSpherefamily 10.2
Information Management 8.2
Lotus 9.7
Tivoli 11.5
Rational 3.6
Othermiddleware (1.4)
Operatingsystems 2,426 2,474 (2.0)
Other 775 652 18.8
* Reclassifiedtoconformwith2005presentation.
Softwarerevenueincreased4.4percent(3.7percentadjusted
for currency) in 2005 versus 2004 as the software market
remains highly competitive. The company believes it gained
marketshareinallfivekeymiddlewarebrandsin2005andheld
marketshareintotalMiddleware.
TheWebSpherefamilyofproductsrevenueincreasedwith
growth in WebSphere Application Servers (15 percent) and
WebSphere Portals (12 percent) software versus 2004. The
WebSphere family provides the foundation technologies for
clients implementingbusinessprocessesandapplicationsina
ServicesOrientedArchitecture(SOA).Asclients’ interestinSOA
has increased, so has the demand for highly scalable, robust
infrastructureplatforms,suchasWebSphere.
Information Management software revenue increased
drivenbygrowthincontentmanagementandinformationinte-
grationproductsets.
Lotus software revenue increased as clients continue to
demonstratestrongresponsetotheDominoVersion7product
line, as well as very high interest in Workplace software.
Workplacesoftwaremorethandoubleditsrevenuein2005ver-
sus2004.
Tivolisoftwarerevenueincreasedwithstronggrowthinstor-
agesoftwareasclients’ adoptionofthecompany’svirtualization
technologiescontinuedtogaintraction. Tivolisystemsmanage-
ment and security software offerings also had good revenue
growthin2005versus2004. Thesecurityproductsrevenuewas
drivenbythecompany’snewSOASecurityofferingswhichwere
wellreceivedinthesecondhalfof2005.
Rationalsoftwarerevenueincreasedin2005 versus 2004,
however,lateinthefourthquarterof2005, client buyingdefer-
ralspreventedstrongerperformance.
Revenue from Other middleware products, including host
software products such as compilers, certain tools and Other
StorageandPrintersoftwaredeclinedversus2004.
OperatingSystemssoftwarerevenuedeclinedin2005ver-
sus2004,primarilyduetolowerzSeriesandpSeriesrevenue,
partiallyoffsetbyincreasediSeriesandxSeriesrevenue.
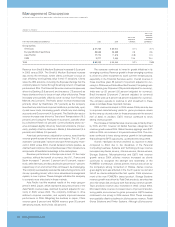
(Dollarsinmillions)
YR. TOYR.
FORTHEYEARENDEDDECEMBER31: 2005 2004 CHANGE
Software:
Grossprofit $«13,781 $«13,161 4.7%
Grossprofitmargin 87.5% 87.2% 0.3 pts.
TheincreaseintheSoftwaregrossprofitdollarsandgrossprofit
marginwasprimarilydrivenbygrowthinSoftwarerevenue and
reducedexternalroyaltycosts.
GLOBAL FINANCING
Seepage 44 foradiscussionofGlobalFinancing’srevenueand
grossprofit.
ENTERPRISE INVESTMENTS
RevenuefromEnterpriseInvestmentsincreased1.9percentto
$1,203million(1.6percent adjusted forcurrency)in2005versus
2004.Therevenueincreasewasattributabletohigher product
life-cyclemanagementsoftwarerevenueprimarilyfor Industrial
(5percent)and Small&MediumBusiness clients (2percent).
Grossprofitdollarsincreased8.0percentto$563millionin
2005versus2004. Thegrossprofitmarginincreased2.6points
to46.8percentin2005versus2004.Theincreaseingrossprofit
dollarsandgrossprofitmarginin2005wasprimarilydrivenby
theincreasedproductlife-cyclemanagementsoftwarerevenue.
FinancialPosition
DYNAMICS
The assets and debt associated with the company’s Global
Financingbusinessareasignificantpartofthecompany’sfinan-
cial position. Thefinancialpositionamountsappearingbelowand
on pages 31 and 32 are the company’s consolidated amounts
including Global Financing. However, to the extent the Global
Financingbusinessisamajordriveroftheconsolidatedfinancial
position, this narrative section will refer to the separate Global
Financing section in this Management Discussion on pages 43
through 47. The amounts appearing in the separate Global
Financingsectionaresupplementarydatapresentedtofacilitate
anunderstandingofthecompany’sGlobalFinancingbusiness.
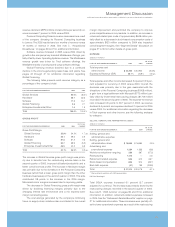
WORKING CAPITAL
(Dollarsinmillions)
ATDECEMBER31: 2005 2004
Currentassets $«45,661 $«47,143
Currentliabilities 35,152 39,786
Workingcapital $«10,509 $«««7,357
Currentratio 1.30 1.18
Current assets decreased $1,482 million due to declines of
$3,708 million in short-term receivables primarily driven by
declinesof: $1,100million in financingreceivablesascollections
exceededneworiginations,approximately$300million intrade
receivables due to the divestiture of the Personal Computing
business, approximately $375 million in non-client receivables