IBM 2005 Annual Report Download - page 25
Download and view the complete annual report
Please find page 25 of the 2005 IBM annual report below. You can navigate through the pages in the report by either clicking on the pages listed below, or by using the keyword search tool below to find specific information within the annual report.-
 1
1 -
2
-
3
-
4
-
5
-
6
-
7
-
8
-
9
-
10
-
11
-
12
-
13
-
14
-
 15
15 -
 16
16 -
 17
17 -
 18
18 -
 19
19 -
 20
20 -
 21
21 -
 22
22 -
 23
23 -
 24
24 -
 25
25 -
 26
26 -
 27
27 -
 28
28 -
 29
29 -
 30
30 -
 31
31 -
 32
32 -
 33
33 -
 34
34 -
 35
35 -
36
-
37
-
38
-
39
-
40
-
41
-
42
-
43
-
44
-
45
-
46
-
47
-
48
-
49
-
50
-
51
-
52
-
53
-
54
-
55
-
56
-
57
-
58
-
59
-
60
-
61
-
62
-
63
-
64
-
65
-
66
-
67
-
68
-
69
-
70
-
71
-
72
-
73
-
74
-
75
-
76
-
77
-
78
-
79
-
80
-
81
-
82
-
83
-
84
-
85
-
86
-
87
-
88
-
89
-
90
-
91
-
92
-
93
-
94
-
95
-
96
-
97
-
98
-
99
-
100
-
101
-
102
-
103
-
104
-
105
 |
 |

ManagementDiscussion
INTERNATIONALBUSINESSMACHINESCORPORATION ANDSUBSIDIARYCOMPANIES
24_ ManagementDiscussion
RevenuefromSmall&MediumBusinessincreased6.5percent
in 2005 versus 2004. The Small & Medium Business increase
wasled by the Americas,whereclientscontinuedto focus on
cost,efficiencyandbusinessvalueintheirITdecisions.Clients
valuetheIBMsolutions,includingtheExpressofferingsthatthe
companytakestomarketthroughitsstrongnetworkofbusiness
partnersand ISVs.TheFinancialServicesrevenueincreasewas
drivenbyBanking(3.8percent)andInsurance(7.3percent)as
theseclientscontinuetofocusonbackofficeefficiencies.These
increaseswerepartiallyoffsetbylowerrevenuefromFinancial
Markets(10.5percent).ThePublicsectorrevenueincreasewas
primarily driven by Healthcare (19.7 percent) as the company
launchednewsolutionstoimprovehealthcare productivity,qual-
ityandlowercosts,increasinggrowthatbothnewandexisting
accountsandGovernment(4.5percent).TheDistributionsector
revenueincreasewasdrivenbyTravelandTransportation(16.2
percent) and ConsumerProducts(11.4percent),partiallyoffset
byadeclineinRetail(4.5 percent).Communicationssectorrev-
enueincreasedslightlydrivenbyTelecommunications (2.6per-
cent),partiallyoffsetbydeclinesinMedia&Entertainment(6.5
percent)andUtilities(0.5percent).
America’sperformance, adjustedforcurrency,wasdrivenby
revenuegrowthacrossallkeybrandsandregions.TheU.S. grew
3 percent,Canadagrew 7 percentandLatinAmericagrew 11 per-
centin 2005 versus 2004.Overall demandremains positive,as
clientsinvesttoimprovethecompetitivenessoftheirinfrastructure
andprovidedifferentiatedadvantageinthemarketplace.
Revenueperformance in Europe was mixed. Of themajor
countries,withoutthebenefitofcurrency,theU.K.,Franceand
Spain increased 7 percent, 2 percent and 5 percent, respec-
tively,whileGermanyandItalydeclined6percentand7percent,
respectively,inanenvironmentthatcontinuestobechallenging.
Thecompanysuccessfullyexecuteditsrestructuringactions,and
itsnewoperatingmodel,withamorestreamlinedmanagement
system,isnowinplace.Thesechangeswillallowthecompany
tocompetemoreeffectivelyinthesemarkets.
Asia Pacific had the weakest results of the major geogra-
phiesin2005.Japan,whichrepresentsabout60percentofthe
AsiaPacificrevenuebase,declined5percentadjustedforcur-
rency in 2005 versus 2004. The company continues to drive
actions to improve execution, and expects improved revenue
performance in 2006. Mitigating the declines in Japan, China
revenuegrew 8 percentandASEANrevenuegrew 20 percent
withstrongresults,ledbyIndia(55percent).
The company continued to invest in growth initiatives in its
emergingcountries.Revenuegrowthintheseemergingcountries
is driven by client investment to build out their infrastructures,
especially in the Financial Services sector. Overall revenue in
these countries grew 23 percent (14 percent adjusted for cur-
rency)in2005versus2004withoutthePersonal Computing busi-
ness.Russiagrew29percent(29percent adjustedfor currency);
India was up 59 percent (55 percent adjusted for currency);
Brazil increased 29 percent (7 percent adjusted for currency)
andChinawasup9percent(8percent adjustedfor currency).
The company expects to continue to shift investment to these
areastoaddresstheseimportantmarkets.
OEMrevenueincreasedin2005versus2004primarilydue
to improved manufacturing yields for game processors driven
bytherampupofproductionfortheseprocessorsinthesecond
half of 2005. In addition, E&TS revenue continued to show
strongrevenuegrowth.
TheincreaseinGlobalServicesrevenuewasprimarilydriven
by BCS and SO, however all Global Services categories had
revenuegrowthversus2004.GlobalServicessigningswere$47.1
billionin2005,anincreaseof9.5percentversus2004.Thecom-
panycontinuedtohavestrongrevenuegrowthinits businesses
thataddresstheBPTSopportunity,up28percentversus2004.
Overall, Hardware revenue declined as reported in 2005
compared to 2004 due to the divestiture of the Personal
Computing business.SystemsandTechnologyGrouprevenue
increasedaspSeriesservers,xSeries servers, iSeriesservers,
Storage Systems, Microelectronics and E&TS had revenue
growth versus 2004. pSeries revenue increased as clients
continued to recognize the strength and leadership of the
POWER5+ architecture.xSeriesserversrevenuewasdrivenby
the company’s strong momentum in Blades. iSeries revenue
grewslightlyandwasaffectedinthefourthquarterasdemand
fell off as clients anticipated the first quarter 2006 announce-
ment of the new POWER5+ based product. Storage Systems
revenuegrowthwasdrivenbyTotalDiskproducts,asenterprise
andmid-rangediskproductsbothhadstrongrevenuegrowth.
Tape products revenue also increased in 2005 versus 2004.
Microelectronicsrevenueincreasedduetoimprovedmanufac-
turingyieldsandvolumesforgameprocessors.E&TSrevenue
continued to be strong in 2005 versus 2004. These increases
werepartiallyoffsetbydeclinesinzSeriesserverrevenue,Retail
Stores Solutions and Printer Systems. Although zSeries server
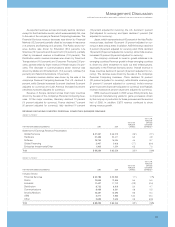
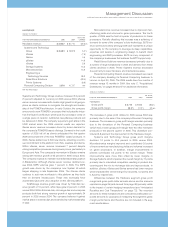
(Dollarsinmillions)
YR. TOYR.
PERCENT
YR. TOYR. CHANGE
PERCENT CONSTANT
FORTHEYEARENDEDDECEMBER31: 2005 2004 CHANGE CURRENCY
Geographies:
Americas $«37,725 $«35,904 5.1% 3.7%
Europe/MiddleEast/Africa 29,549 28,889 2.3 3.6
AsiaPacific 17,714 17,878 (0.9) (1.1)
OEM 3,271 2,885 13.4 13.4
Total $«88,259 $«85,556 3.2% 2.8%%