IBM 2005 Annual Report Download - page 23
Download and view the complete annual report
Please find page 23 of the 2005 IBM annual report below. You can navigate through the pages in the report by either clicking on the pages listed below, or by using the keyword search tool below to find specific information within the annual report.-
 1
1 -
2
-
3
-
4
-
5
-
6
-
7
-
8
-
9
-
10
-
11
-
12
-
 13
13 -
 14
14 -
 15
15 -
 16
16 -
 17
17 -
 18
18 -
 19
19 -
 20
20 -
 21
21 -
 22
22 -
 23
23 -
 24
24 -
 25
25 -
 26
26 -
 27
27 -
 28
28 -
 29
29 -
 30
30 -
 31
31 -
 32
32 -
 33
33 -
34
-
35
-
36
-
37
-
38
-
39
-
40
-
41
-
42
-
43
-
44
-
45
-
46
-
47
-
48
-
49
-
50
-
51
-
52
-
53
-
54
-
55
-
56
-
57
-
58
-
59
-
60
-
61
-
62
-
63
-
64
-
65
-
66
-
67
-
68
-
69
-
70
-
71
-
72
-
73
-
74
-
75
-
76
-
77
-
78
-
79
-
80
-
81
-
82
-
83
-
84
-
85
-
86
-
87
-
88
-
89
-
90
-
91
-
92
-
93
-
94
-
95
-
96
-
97
-
98
-
99
-
100
-
101
-
102
-
103
-
104
-
105
 |
 |

ManagementDiscussion
INTERNATIONALBUSINESSMACHINESCORPORATION ANDSUBSIDIARYCOMPANIES
22_ ManagementDiscussion
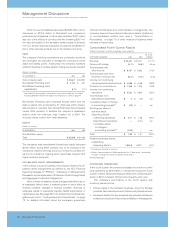
YearinReview
ResultsofContinuingOperations
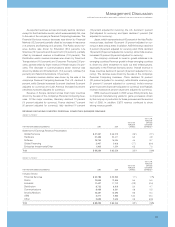
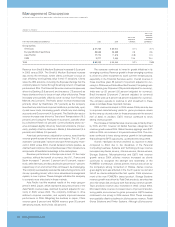
REVENUE
(Dollarsinmillions)
YR. TOYR.
PERCENT
YR. TOYR. CHANGE
PERCENT CONSTANT
FORTHEYEARENDEDDECEMBER31: 2005 2004 CHANGE CURRENCY
StatementofEarningsRevenuePresentation:
GlobalServices $«47,357 $«46,213 2.5% 2.1%%
Hardware 24,314 31,154 (22.0) (22.2)
Software 15,753 15,094 4.4 3.7
GlobalFinancing 2,407 2,608 (7.7) (8.4)
EnterpriseInvestments/Other 1,303 1,224 6.5 7.0
Total $«91,134 $«96,293 (5.4) % (5.8) %
(Dollarsinmillions)
YR. TOYR.
PERCENT
YR. TOYR. CHANGE
PERCENT CONSTANT
FORTHEYEARENDEDDECEMBER31: 2005 2004* CHANGE CURRENCY
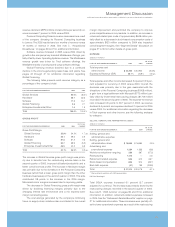
IndustrySector:
FinancialServices $«24,059 $«24,479 (1.7) % (1.8) %
Public 14,020 14,769 (5.1) (5.5)
Industrial 11,666 12,610 (7.5) (7.7)
Distribution 8,844 8,831 0.1 (0.2)
Communications 8,589 8,888 (3.4) (3.8)
Small&Medium 17,969 20,793 (13.6) (13.7)
OEM 3,271 2,885 13.4 13.4
Other 2,716 3,038 (10.6) (16.8)
Total $«91,134 $«96,293 (5.4) % (5.8) %
*Reclassifiedtoconformwith2005presentation.
(Dollarsinmillions)
YR. TOYR.
PERCENT
YR. TOYR. CHANGE
PERCENT CONSTANT
FORTHEYEARENDEDDECEMBER31: 2005 2004 CHANGE CURRENCY
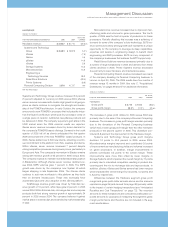
Geographies:
Americas $«38,817 $«40,064 (3.1) % (4.4) %%
Europe/MiddleEast/Africa 30,428 32,068 (5.1) (4.1)
AsiaPacific 18,618 21,276 (12.5) (12.7)
OEM 3,271 2,885 13.4 13.4
Total $«91,134 $«96,293 (5.4) % (5.8)) %%
On April 30, 2005, the company sold its Personal Computing
business.Accordingly,thecompany’sreportedrevenueresults
include four months of revenue for the company’s Personal
Computing business in 2005 versus 12 months in 2004. The
company has presented a discussion on changes in reported
revenuesalongwithadiscussionof revenueresultsexcluding
thedivestedPersonalComputingbusiness.Asignificantdriver
of the changes in revenues, on an as-reported basis, is the
incomparableperiodsfor which the Personal Computing busi-
nessresultsareincludedintheas-reportedresults.Thecompany
believesthatamoreappropriatediscussionisonethatexcludes
therevenueresultsofthePersonalComputingbusinessinboth
2005 and 2004 because it presents results on a comparable
basis and provides a more meaningful discussion which
focuses on the company’s ongoing operational performance.
Suchdiscussionispresentedonpages24and25.