IBM 2005 Annual Report Download - page 24
Download and view the complete annual report
Please find page 24 of the 2005 IBM annual report below. You can navigate through the pages in the report by either clicking on the pages listed below, or by using the keyword search tool below to find specific information within the annual report.-
 1
1 -
2
-
3
-
4
-
5
-
6
-
7
-
8
-
9
-
10
-
11
-
12
-
13
-
 14
14 -
 15
15 -
 16
16 -
 17
17 -
 18
18 -
 19
19 -
 20
20 -
 21
21 -
 22
22 -
 23
23 -
 24
24 -
 25
25 -
 26
26 -
 27
27 -
 28
28 -
 29
29 -
 30
30 -
 31
31 -
 32
32 -
 33
33 -
 34
34 -
35
-
36
-
37
-
38
-
39
-
40
-
41
-
42
-
43
-
44
-
45
-
46
-
47
-
48
-
49
-
50
-
51
-
52
-
53
-
54
-
55
-
56
-
57
-
58
-
59
-
60
-
61
-
62
-
63
-
64
-
65
-
66
-
67
-
68
-
69
-
70
-
71
-
72
-
73
-
74
-
75
-
76
-
77
-
78
-
79
-
80
-
81
-
82
-
83
-
84
-
85
-
86
-
87
-
88
-
89
-
90
-
91
-
92
-
93
-
94
-
95
-
96
-
97
-
98
-
99
-
100
-
101
-
102
-
103
-
104
-
105
 |
 |

ManagementDiscussion
INTERNATIONALBUSINESSMACHINESCORPORATION ANDSUBSIDIARYCOMPANIES
_23
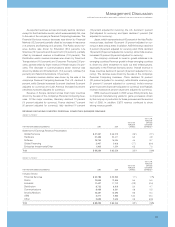
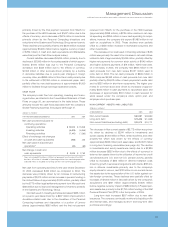
REVENUE EXCLUDING DIVESTED PERSONAL COMPUTING BUSINESS REVENUE
(Dollarsinmillions)
YR. TOYR.
PERCENT
YR. TOYR. CHANGE
PERCENT CONSTANT
FORTHEYEARENDEDDECEMBER31: 2005 2004 CHANGE CURRENCY
StatementofEarningsRevenuePresentation:
GlobalServices $«47,357 $«46,213 2.5% 2.1%
Hardware 21,439 20,417 5.0 4.9
Software 15,753 15,094 4.4 3.7
GlobalFinancing 2,407 2,608 (7.7) (8.4)
EnterpriseInvestments/Other 1,303 1,224 6.5 7.0
Total $«88,259 $«85,556 3.2% 2.8%%
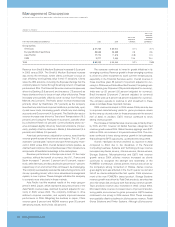
(Dollarsinmillions)
YR. TOYR.
PERCENT
YR. TOYR. CHANGE
PERCENT CONSTANT
FORTHEYEARENDEDDECEMBER31: 2005 2004 CHANGE CURRENCY
IndustrySector:
FinancialServices $«23,789 $«23,393 1.7% 1.7%%
Public 13,556 12,858 5.4 5.0
Industrial 11,437 11,702 (2.3) (2.4)
Distribution 8,722 8,309 5.0 4.7
Communications 8,458 8,391 0.8 0.5
Small&Medium 16,387 15,393 6.5 6.4
OEM 3,271 2,885 13.4 13.4
Other 2,639 2,625 0.5 (6.6)
Total $«88,259 $«85,556 3.2% 2.8%%
As-reportedrevenuesacrossallindustrysectorsdeclined,
exceptfortheDistributionsector,whichwasessentiallyflat,due
tothesaleofthecompany’sPersonalComputingbusiness.The
Financial Services revenue decrease was driven by Financial
Markets(12.2percent)partiallyoffsetbyincreasesinInsurance
(1.9percent)andBanking(0.5percent).ThePublicsectorrev-
enue decline was driven by Education (31.0 percent), Life
Sciences(19.1 percent)andGovernment(2.0percent),partially
offset by increased revenue in Healthcare (13.1 percent). The
Distribution sector revenue increase was driven by Travel and
Transportation(11.0percent)andConsumerProducts(2.6 per-
cent),partiallyoffsetbylowerrevenueinRetailIndustry(7.5per-
cent). The decrease in Communications sector revenue was
drivenby MediaandEntertainment (11.5percent),Utilities(5.4
percent)andTelecommunications(1.1 percent).
America’s revenue decline was driven by the sale of the
company’sPersonalComputingbusiness.TheU.S.declined5
percent,whileCanadaincreased5percent(declined3percent
adjustedforcurrency)and Latin America increased8 percent
(declined2percentadjustedforcurrency).
Revenue in Europe declined across most major countries
drivenbythesaleofthecompany’sPersonalComputingbusi-
ness. Of the major countries, Germany declined 12 percent
(11 percent adjusted for currency), France declined 7 percent
(6 percent adjusted for currency), Italy declined 11 percent
(10percentadjustedforcurrency),theU.K. declined 1 percent
(flat adjusted for currency) and Spain declined1 percent (flat
adjusted forcurrency).
Japan,whichrepresentsabout60percentoftheAsiaPacific
revenuebase,declined13percent(11 percentadjustedforcur-
rency)in2005versus2004.Inaddition,ASEANrevenuedeclined
3percent(3percentadjusted forcurrency)andChinadeclined
19percent(20percentadjustedforcurrency),whileIndiarevenue
increased10percent(8percentadjustedforcurrency).
The company continued to invest in growth initiatives in its
emergingcountries.Revenuegrowthintheseemergingcountries
is driven by client investment to build out their infrastructures,
especially in the Financial Services sector. Overall revenue in
thesecountriesdeclined2percent(9percentadjustedforcur-
rency).Thedeclinesweredrivenbythesaleofthecompany’s
Personal Computing business. China declined 19 percent
(20 percentadjusted forcurrency),whileBrazil’srevenuegrew
21 percent (1 percent adjusted for currency), India’s revenue
grew10percent(8percentadjustedforcurrency)andRussia’s
revenueincreased2percent(2percentadjustedforcurrency).
OEMrevenueincreasedin2005versus2004primarilydue
to improved manufacturing yields for game processors driven
bytherampupofproductionfortheseprocessorsinthesecond
half of 2005. In addition, E&TS revenue continued to show
strongrevenuegrowth.