IBM 2005 Annual Report Download - page 28
Download and view the complete annual report
Please find page 28 of the 2005 IBM annual report below. You can navigate through the pages in the report by either clicking on the pages listed below, or by using the keyword search tool below to find specific information within the annual report.-
 1
1 -
2
-
3
-
4
-
5
-
6
-
7
-
8
-
9
-
10
-
11
-
12
-
13
-
14
-
15
-
16
-
17
-
 18
18 -
 19
19 -
 20
20 -
 21
21 -
 22
22 -
 23
23 -
 24
24 -
 25
25 -
 26
26 -
 27
27 -
 28
28 -
 29
29 -
 30
30 -
 31
31 -
 32
32 -
 33
33 -
 34
34 -
 35
35 -
 36
36 -
 37
37 -
 38
38 -
39
-
40
-
41
-
42
-
43
-
44
-
45
-
46
-
47
-
48
-
49
-
50
-
51
-
52
-
53
-
54
-
55
-
56
-
57
-
58
-
59
-
60
-
61
-
62
-
63
-
64
-
65
-
66
-
67
-
68
-
69
-
70
-
71
-
72
-
73
-
74
-
75
-
76
-
77
-
78
-
79
-
80
-
81
-
82
-
83
-
84
-
85
-
86
-
87
-
88
-
89
-
90
-
91
-
92
-
93
-
94
-
95
-
96
-
97
-
98
-
99
-
100
-
101
-
102
-
103
-
104
-
105
 |
 |

ManagementDiscussion
INTERNATIONALBUSINESSMACHINESCORPORATION ANDSUBSIDIARYCOMPANIES
_27
general and administrative expense ($308 million); Research,
developmentandengineeringexpense($94million);and,Other
(income) and expense ($8 million). See note U, “Stock-Based
Compensation,” onpages 83 to 85 foradditionalinformation.
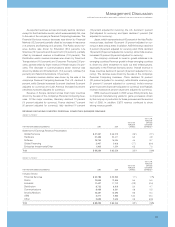
RETIREMENT-RELATED BENEFITS
Thefollowing table providesthe total pre-taxcostfor allretire-
ment-relatedplans.Costamountsareincludedasanadditionto
thecompany’scostandexpenseamountsintheConsolidated
Statement of Earnings within the caption (e.g., Cost, SG&A,
RD&E)relatingtothejobfunctionoftheindividualsparticipating
intheplans.
(Dollarsinmillions)
YR. TOYR.
FORTHEYEARENDEDDECEMBER31: 2005 2004 CHANGE
Retirement-relatedplanscost:
Definedbenefitandcontribution
pensionplanscost $«2,058 $«1,072 92.0%%
Nonpensionpostretirement
planscosts 379 372 1.9
Total $«2,437 $«1,444 68.8%
Overall,retirement-relatedplancostsincreased$993millionver-
sus 2004. The 2005 increase was driven by the amortization of
deferredcharges,aswellaschangesinthediscountrates,akey
assumption underlying the valuation of the plans. During 2005,
the company recognized approximately $1,100 million of previ-
ouslydeferredactuariallosses(asaresultoftheamortizationof
assumptionchanges)whichcontributedapproximately$700mil-
lionoftheincreaseinretirement-relatedexpensein2005.Inaddi-
tion,onDecember 31,2004,the company lowered the discount
rate assumption inanumberofcountries whichincreasedpre-tax
expense by approximately $300 million in 2005. Additionally,
during2005,thecompanyrecordedacurtailmentchargeof$267
million in the fourth quarter as a result of U.S. pension plan
amendments,aswellasa$65millionchargeinthesecondquar-
terrelatedtotherestructuringactions.Offsettingtheyear-to-year
effectsofthese one-time charges recordedin2005 was a one-
timechargeof $320millionrecordedin2004forthepartialsettle-
mentofcertainlegalclaimsagainsttheU.S.pensionplan.
The $993 million year-to-year increase impacted Cost,
SG&A, RD&EandOther(income)and expensebyapproximately
$648 million, $236 million, $95 million and $14 million, respec-
tively.Seenote V,“Retirement-RelatedBenefits,” onpages 85 to
95 for a detailed discussion of the company’s benefit plans
including a description of the plans, accounting policies, plan
financialinformationandassumptions.
INCOME TAXES
Theprovisionforincometaxesresultedinaneffectivetaxrateof
34.6 percentfor2005,comparedwiththe2004 effectivetaxrate
of 29.7 percent.The 4.9 point increaseintheeffectivetaxratein
2005 wasprimarilyduetothe third-quarter2005taxchargeasso-
ciated with the repatriation of $9.5 billion under the American
JobsCreationActof 2004. Seenote P, “Taxes,” onpage 80 for
additionalinformationconcerningthisrepatriationtaxcharge.
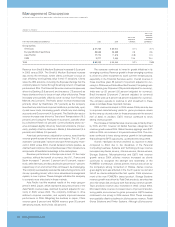
WEIGHTED-AVERAGE COMMON SHARES
YR. TOYR.
FORTHEYEARENDEDDECEMBER31: 2005 2004 CHANGE
Earningspershareof
commonstock:
Assumingdilution:
Continuingoperations $«««««4.91 $«««««4.39 11.8%
Discontinuedoperations «(0.01) «(0.01) 45.0
Cumulativeeffect
ofchangein
accountingprinciple** «(0.02) «««««— NM
Total $«««««4.87* $«««««4.38 11.2%
Basic:
Continuingoperations $«««««4.99 $«««««4.48 11.4%
Discontinuedoperations «(0.02) «(0.01) 44.6
Cumulativeeffect
ofchangein
accountingprinciple** «(0.02) ««««— NM
Total $«««««4.96* $«««««4.47 11.0%
Weighted-averageshares
outstanding(inmillions):
Assumingdilution «1,627.6 ««««1,707.2 (4.7) %
Basic 1,600.6 1,675.0 (4.4)
* Doesnottotalduetorounding.
** ReflectsimplementationofFASBInterpretationNo.47.Seenote B,“Accounting
Changes,” onpages61 and62 foradditionalinformation.
NM—NotMeaningful
Theaveragenumberofcommonsharesoutstandingassuming
dilutionwaslowerby 79.6 millionsharesin2005 versus 2004.
Thedecreasewasprimarilytheresultofthecompany’scommon
share repurchase program. See note N, “Stockholders’ Equity
Activity,” onpages 75 and 76 foradditionalinformationregard-
ingthecommonshareactivities.Alsoseenote S,“EarningsPer
ShareofCommonStock,” onpage 82.
SegmentDetails
The following is an analysis of the 2005 versus 2004 external
segmentresults.Theanalysisof2004versus2003externalseg-
mentresultsisonpages 34 to 36.
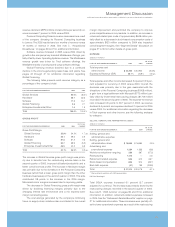
GLOBAL SERVICES
(Dollarsinmillions)
YR. TOYR.
FORTHEYEARENDEDDECEMBER31: 2005 2004 CHANGE
GlobalServicesrevenue: $«47,357 $«46,213 2.5%
StrategicOutsourcing $«19,766 $«19,309 2.4%
BusinessConsultingServices 14,185 13,767 3.0
IntegratedTechnologyServices 7,538 7,441 1.3
Maintenance 5,868 5,696 3.0
Global Services revenue increased 2.5 percent (2.1 percent
adjusted for currency) in 2005 versus 2004. Although SO rev-
enuecontinuedtogrow,itexperiencedaslowdowninitsrevenue