IBM 2005 Annual Report Download - page 27
Download and view the complete annual report
Please find page 27 of the 2005 IBM annual report below. You can navigate through the pages in the report by either clicking on the pages listed below, or by using the keyword search tool below to find specific information within the annual report.-
 1
1 -
2
-
3
-
4
-
5
-
6
-
7
-
8
-
9
-
10
-
11
-
12
-
13
-
14
-
15
-
16
-
 17
17 -
 18
18 -
 19
19 -
 20
20 -
 21
21 -
 22
22 -
 23
23 -
 24
24 -
 25
25 -
 26
26 -
 27
27 -
 28
28 -
 29
29 -
 30
30 -
 31
31 -
 32
32 -
 33
33 -
 34
34 -
 35
35 -
 36
36 -
 37
37 -
38
-
39
-
40
-
41
-
42
-
43
-
44
-
45
-
46
-
47
-
48
-
49
-
50
-
51
-
52
-
53
-
54
-
55
-
56
-
57
-
58
-
59
-
60
-
61
-
62
-
63
-
64
-
65
-
66
-
67
-
68
-
69
-
70
-
71
-
72
-
73
-
74
-
75
-
76
-
77
-
78
-
79
-
80
-
81
-
82
-
83
-
84
-
85
-
86
-
87
-
88
-
89
-
90
-
91
-
92
-
93
-
94
-
95
-
96
-
97
-
98
-
99
-
100
-
101
-
102
-
103
-
104
-
105
 |
 |

ManagementDiscussion
INTERNATIONALBUSINESSMACHINESCORPORATION ANDSUBSIDIARYCOMPANIES
26_ ManagementDiscussion
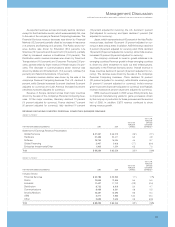
OTHER(INCOME)ANDEXPENSE
(Dollarsinmillions)
YR. TOYR.
FORTHEYEARENDEDDECEMBER31: 2005 2004* CHANGE
Other(income)andexpense:
Foreigncurrency
transactionlosses $«««««170 $««381 (55.4) %
Interestincome (307) (180) 70.6
Netrealizedgainsonsalesof
securitiesandotherinvestments (111) (59) 88.1
Netrealized(gains)/lossesfrom
certainrealestateactivities (179) (71) 152.1
Restructuring 231 —NM
Lenovo/Microsoftgains (1,883) —NM
Other (43) (94) (54.3)
Total $«(2,122) $«««(23) NM
* Reclassifiedtoconformwith2005presentation.
NM—NotMeaningful
Other(income) and expense wasincome of $2,122 millionand
$23 millionin2005and2004,respectively.Theincreasewaspri-
marilydrivenbythegainonthesaleofthecompany’sPersonal
Computing business. The pre-tax gain associated with this
transaction was $1,108 million. See note C, “Acquisitions/
Divestitures” on pages 66 to 67 for additional information. In
addition, the company settled certain antitrust issues with the
MicrosoftCorporationandthegainfromthissettlementwas$775
million;additionalInterestincomegeneratedbythecompanyin
2005;andlowerforeigncurrencytransactionlosseswhichrelate
tolossesoncertainhedgecontractsoffsetby settlementoffor-
eign currency receivables and payables. See “Currency Rate
Fluctuations,” on page 42 for additionaldiscussion of currency
impacts on the company’s financial results. The company also
hadadditionalgainsfromthesaleofcertainrealestatetransac-
tionsin 2005 versus 2004.These gainswerepartially offset by
real-estaterelatedrestructuringchargesrecordedinthesecond
quarterof2005.Seenote R,“2005Actions” onpages 80 and81
foradditionalinformation.
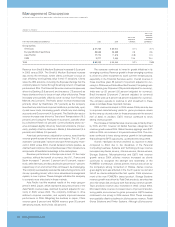
RESEARCH,DEVELOPMENTANDENGINEERING
(Dollarsinmillions)
YR. TOYR.
FORTHEYEARENDEDDECEMBER31: 2005 2004 CHANGE
Research,development
andengineering:
Total $«5,842 $«5,874 (0.6) %
ThedeclineinResearch, developmentand engineering(RD&E)
was driven by the sale of the company’s Personal Computing
businessinthesecondquarterof2005($93million)andlower
spending in Microelectronics ($93 million) and Software ($25
million). These decreases were partially offset by increased
spendinginSystemsandTechnologyforserverproducts($171
million).Included in RD&Eexpense was increasedretirement-
relatedexpenseof$95 million andadecreaseof$94millionfor
stock-basedcompensationexpensein2005versus2004.
INTELLECTUALPROPERTYANDCUSTOMDEVELOPMENTINCOME
(Dollarsinmillions)
YR. TOYR.
FORTHEYEARENDEDDECEMBER31: 2005 2004 CHANGE
Intellectualpropertyand
customdevelopmentincome:
Salesandothertransfers
ofintellectualproperty $«236 $««««466 (49.4) %%
Licensing/royalty-basedfees 367 393 (6.6)
Customdevelopmentincome 345 310 11.3
Total «$«948 $«1,169 (19.0) %
Thedecreasein Sales andothertransfersofintellectualprop-
erty was primarily due to Applied Micro Circuits Corporation’s
(AMCC) acquisition of the company’s IP associated with its
embeddedPowerPC4xxstandardproductsfor$208millionin
2004. ThetimingandamountofSalesandothertransfersofIP
may vary significantly from period to period depending upon
timing of divestitures, industry consolidation, economic condi-
tionsandthetimingofnewpatentsandknow-howdevelopment.
actions and the Personal Computing business divestiture,
lower stock-based compensation expense (see “Stock-Based
Compensation” caption below for additional information) and
lower ongoing workforce reductions. In addition, Bad debt
expensedeclinedprimarilydueto decreasedspecificreserve
requirements, an overallreductioninthefinancingassetportfo-
lio(seeGlobalFinancingReceivablesandAllowancesonpage
45 for additional information), the improvement in economic
conditionsandimprovedcreditquality.
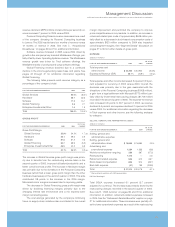
INTERESTEXPENSE
(Dollarsinmillions)
YR. TOYR.
FORTHEYEARENDEDDECEMBER31: 2005 2004 CHANGE
Interestexpense:
Total $«220 $«139 58.6%%
The increase in Interest expense was primarily driven by higher
average non-Global Financing debt and higher effective interest
ratesin2005versus2004.InterestexpenseispresentedinCostof
GlobalFinancingintheConsolidatedStatementofEarningsonlyif
the related external borrowings are to support the Global
Financingexternalbusiness.Seepages 46 and 47 foradditional
informationregardingGlobalFinancingdebtandinterestexpense.
STOCK-BASED COMPENSATION
Total pre-tax stock-based compensation expense of $1,035 mil-
lion decreased $543 million compared to 2004. This decrease
wasprincipallytheresultofchangesinthecompany’sequitypro-
grams, primarily driven by: (1) a reduction in the level and fair
value ofstockoptiongrants($306million)and(2)changestothe
terms of the company’s employee stock purchase plan, which
renderedit non-compensatory in thesecond quarter of 2005 in
accordancewiththeprovisionsofSFAS 123(R)($186million).The
year-to-year reductions in pre-tax compensation expense were
reflectedinthefollowingcategories:Cost($133million);Selling,