IBM 2005 Annual Report Download - page 100
Download and view the complete annual report
Please find page 100 of the 2005 IBM annual report below. You can navigate through the pages in the report by either clicking on the pages listed below, or by using the keyword search tool below to find specific information within the annual report.-
 1
1 -
2
-
3
-
4
-
5
-
6
-
7
-
8
-
9
-
10
-
11
-
12
-
13
-
14
-
15
-
16
-
17
-
18
-
19
-
20
-
21
-
22
-
23
-
24
-
25
-
26
-
27
-
28
-
29
-
30
-
31
-
32
-
33
-
34
-
35
-
36
-
37
-
38
-
39
-
40
-
41
-
42
-
43
-
44
-
45
-
46
-
47
-
48
-
49
-
50
-
51
-
52
-
53
-
54
-
55
-
56
-
57
-
58
-
59
-
60
-
61
-
62
-
63
-
64
-
65
-
66
-
67
-
68
-
69
-
70
-
71
-
72
-
73
-
74
-
75
-
76
-
77
-
78
-
79
-
80
-
81
-
82
-
83
-
84
-
85
-
86
-
87
-
88
-
89
-
 90
90 -
 91
91 -
 92
92 -
 93
93 -
 94
94 -
 95
95 -
 96
96 -
 97
97 -
 98
98 -
 99
99 -
 100
100 -
 101
101 -
 102
102 -
 103
103 -
 104
104 -
 105
105
 |
 |

NotestoConsolidatedFinancialStatements
INTERNATIONALBUSINESSMACHINESCORPORATION ANDSUBSIDIARYCOMPANIES
_99
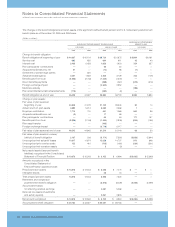
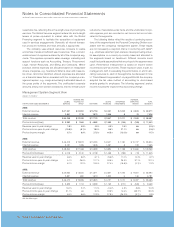
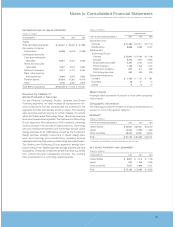
RECONCILIATIONS OF IBM AS REPORTED
(Dollarsinmillions)
ATDECEMBER31: 2005 2004 2003
Assets:
Totalreportablesegments $«««64,027 $«««69,656 $«««67,995
Eliminationofinternal
transactions (5,082) (5,814) (5,596)
Unallocatedamounts:
Cashandmarketable
securities 12,381 9,421 6,523
Notesandaccounts
receivable 3,281 3,872 3,334
Deferredtaxassets 3,311 6,731 8,050
Plant,otherproperty
andequipment 3,068 3,522 3,380
Pensionassets 20,613 20,381 18,416
Other 4,149 3,234 3,919
TotalIBMconsolidated $«105,748 $«111,003 $«106,021
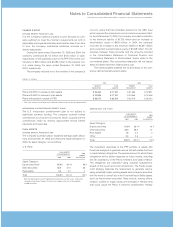
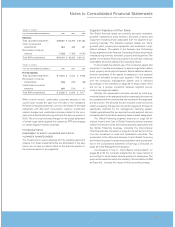
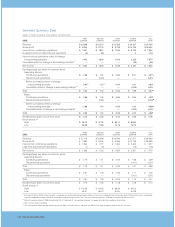
RevenuebyClassesof
SimilarProductsorServices
For the Personal Computing Division, Software and Global
Financing segments, the data on page 96 represents the rev-
enuecontributionsfromthe productsthat arecontainedinthe
segmentsandthatarebasicallysimilarinnature.Thefollowing
tableprovidesexternalrevenueforsimilar classesofproducts
withintheSystemsandTechnologyGroup,GlobalServicesand
EnterpriseInvestmentssegments.TheSystemsandTechnology
Group segment’s Microelectronics OEM hardware comprises
revenueprimarilyfromthesaleofsemiconductors.Technology
servicescomprisetheSystemsandTechnologyGroup’scircuit
designbusinessforitsOEMclients,aswellasthecomponent
design services, strategic outsourcing of clients’ design team
work, and technology and manufacturing consulting services
associatedwiththeEngineering&TechnologyServicesDivision.
The Systems and Technology Group segment’s storage com-
prisesrevenuefromTotalStoragediskstoragesystems and tape
subsystems. EnterpriseInvestmentssoftwarerevenueisprimarily
from product life-cycle management products. The following
tableispresentedonacontinuingoperationsbasis.
(Dollarsinmillions)
CONSOLIDATED
FORTHEYEARENDEDDECEMBER31: 2005 2004 2003
GlobalServices:
Services $«41,489 $«40,517 $«37,178
Maintenance 5,868 5,696 5,457
Systemsand
TechnologyGroup:
Servers $«12,900 $«12,460 $«11,148
Storage 3,345 2,901 2,854
MicroelectronicsOEM «««2,391 «««2,131 «««2,142
PrinterSystems 1,136 1,243 1,344
RetailStoreSystems 627 814 692
Technologyservices 582 424 325
EnterpriseInvestments:
Software $«««1,166 $«««1,131 $««««««981
Hardware 28 37 72
Others 912 12
MajorClients
Nosingle client represents10percentormoreofthecompany’s
totalrevenue.
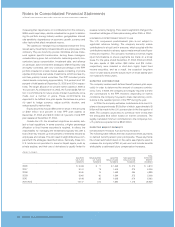
GeographicInformation
Thefollowingprovidesinformationforthosecountriesthatare10
percentormoreofthespecificcategory.
REVENUE*
(Dollarsinmillions)
FORTHEYEARENDEDDECEMBER31: 2005 2004 2003
UnitedStates $«34,951 $«35,637 $«33,762
Japan 10,753 12,295 11,694
Othercountries 45,430 48,361 43,675
Total $«91,134 $«96,293 $«89,131
* Revenuesareattributedtocountriesbasedonlocationof client.
NET PLANT,PROPERTY AND EQUIPMENT
(Dollarsinmillions)
AT DECEMBER31: 2005 2004 2003
UnitedStates $«««6,907 $«««7,516 $«««7,746
Japan 922 1,286 1,306
Othercountries 4,327 4,866 4,201
Total $«12,156 $«13,668 $«13,253