IBM 2005 Annual Report Download - page 45
Download and view the complete annual report
Please find page 45 of the 2005 IBM annual report below. You can navigate through the pages in the report by either clicking on the pages listed below, or by using the keyword search tool below to find specific information within the annual report.-
 1
1 -
2
-
3
-
4
-
5
-
6
-
7
-
8
-
9
-
10
-
11
-
12
-
13
-
14
-
15
-
16
-
17
-
18
-
19
-
20
-
21
-
22
-
23
-
24
-
25
-
26
-
27
-
28
-
29
-
30
-
31
-
32
-
33
-
34
-
 35
35 -
 36
36 -
 37
37 -
 38
38 -
 39
39 -
 40
40 -
 41
41 -
 42
42 -
 43
43 -
 44
44 -
 45
45 -
 46
46 -
 47
47 -
 48
48 -
 49
49 -
 50
50 -
 51
51 -
 52
52 -
 53
53 -
 54
54 -
 55
55 -
56
-
57
-
58
-
59
-
60
-
61
-
62
-
63
-
64
-
65
-
66
-
67
-
68
-
69
-
70
-
71
-
72
-
73
-
74
-
75
-
76
-
77
-
78
-
79
-
80
-
81
-
82
-
83
-
84
-
85
-
86
-
87
-
88
-
89
-
90
-
91
-
92
-
93
-
94
-
95
-
96
-
97
-
98
-
99
-
100
-
101
-
102
-
103
-
104
-
105
 |
 |

ManagementDiscussion
INTERNATIONALBUSINESSMACHINESCORPORATION ANDSUBSIDIARYCOMPANIES
44_ ManagementDiscussion
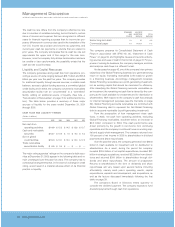
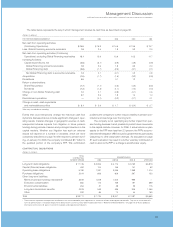
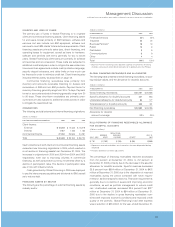
ResultsofOperations
(Dollarsinmillions)
FORTHEYEARENDEDDECEMBER31: 2005 2004 2003
Externalrevenue $«2,401 $«2,607 $«2,827
Internalrevenue 1,506 1,287 1,300
Totalrevenue 3,907 3,894 4,127
Cost 1,648 1,540 1,846
Grossprofit $«2,259 $«2,354 $«2,281
Grossprofitmargin 57.8% 60.5% 55.3%
Pre-taxincome $«1,583 $«1,458 $«1,152
After-taxincome* $«1,032 $««««915 $««««746
Returnonequity* 33.2% 28.6% 22.1%
* Seepage 47 forthedetailsoftheAfter-taxincomeandtheReturnon equity calculation.
TotalGlobalFinancingrevenueincreased0.3 percentin2005as
comparedto2004,drivenbyInternal revenuegrowth.External
revenue decreased 7.9 percent (8.6 percent adjusted for cur-
rency) versus 2004 primarily driven by financing revenue of
$1,720millionin2005versus$1,899millionin2004,adecrease
of9.4percent,duetoloweraverageassetbalancesanddeclin-
ingassetyields.Internalrevenueincreased 17.0 percentversus
2004 driven by used equipment sales of $962 million in 2005
versus$716millionin2004,anincreaseof34.4percent,partially
offsetbyfinancingincomeof$544millionin2005versus$571
millionin2004,adecreaseof 4.7 percent.Theincreaseinused
equipmentsalesisduetohighersalestotheHardware segment,
aswellasearlyterminations ofinternal leases and the subse-
quentsaleofthisequipmenttoGlobalServices.
Total Global Financing revenue declined 5.6 percent in
2004ascomparedto2003.Externalrevenuedecreased7.8per-
cent(11.5percent adjustedfor currency)versus2003, primarily
drivenbyexternalusedequipmentsalesof$708millionin2004
versus$928millionin2003,adecreaseof23.7percent. Internal
revenuedecreased1.0percentin 2004 driven by remarketing
revenueof $783millionin2004versus$828million in 2003,a
decreaseof5.4percent,partiallyoffsetbycommercialfinancing
revenueof$269millionin2004versus$240millionin2003,an
increaseof12.2percent.
GlobalFinancinggrossprofitdollarsdecreased$95million
or 4.0 percent and gross profit margin declined 2.7 points in
2005versus2004.Thedecreaseingrossprofitdollarswaspri-
marily driven by the decline in financing revenue discussed
aboveandborrowingcostsof$641 millionin2005versus$608
millionin2004,anincreaseof5.5percentrelatedtotheinterest
rateenvironmentduringtheyear, partiallyoffsetby equipment
salesgrossprofitof$637millionin2005versus$492millionin
2004,anincreaseof 29.4percentdue to the increaseinused
equipmentsalesdiscussedabove.Thedecreaseingrossprofit
margin was driven by a mix change towards lower margin
remarketing sales and away from higher margin financing
income, and lower financing margins due to higher borrowing
costs related to the interest rate environment during the year,
partiallyoffsetbyanimprovementinequipmentsalesmargins.
GlobalFinancinggrossprofitdollarsincreased$73million
or 3.2 percent and gross profit margin increased 5.2 points in
2004versus2003.Theincreaseingrossprofitdollarswaspri-
marilydrivenbycostofsalesonremarketingequipmentof$932
millionin2004versus$1,168millionin2003,adecreaseof20.3
percentandborrowingcostsof$608millionin2004versus$678
million in 2003, a decrease of10.3 percent related to volumes
andtheinterestrateenvironmentduringtheyear,partiallyoffset
bythedecreaseinrevenuediscussedpreviously.Theincreasein
grossprofitmarginwasdrivenbyimprovedmarginsinfinancing
andequipmentsales,andamixchangetowardshighermargin
financingincome,andawayfromlowermarginequipmentsales.
Global Financing pre-tax income increased 8.6 percent in
2005 versus 2004, compared to an increase of 26.6 percent in
2004versus2003.Theincreasein2005wasdrivenbyadecrease
of$140millioninbaddebtexpense and adecreaseof$78million
in SG&A expense,offsetbythedecreaseingrossprofitof$95
milliondiscussedpreviously.Theincreasein2004versus2003
wasdrivenbyadecreaseof$101 millioninbaddebtexpense,a
decreaseof$17millionin SG&A expense,adecreaseof$100mil-
lioninothercharges primarilydrivenbyincomefrominternalsales,
andtheincreaseingrossprofitof$73milliondiscussedpreviously.
The decrease in bad debt expense in both 2005 and 2004 is
reflective of the improved general economic environment,
improvedcreditqualityoftheportfolio,andthedecliningsizeofthe
receivablesportfolio.(Alsoseepage 45 foranadditionaldiscus-
sionof GlobalFinancing ReceivablesandAllowances.)
Theincreaseinreturnonequityfrom2004to2005 and2003
to2004 wasprimarilyduetohigherearnings.
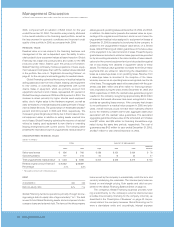
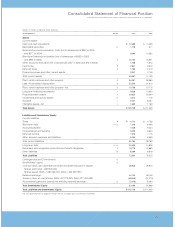
FinancialCondition
BALANCE SHEET
(Dollarsinmillions)
ATDECEMBER31: 2005 2004
Cash $«««1,292 $««««««850
Netinvestmentinsales-typeleases 9,876 11,141
Equipmentunderoperatingleases:
External clients 1,847 1,817
Internal clients(a)(b) 1,788 1,906
Client loans 8,486 9,889
Total client financingassets 21,997 24,753
Commercialfinancingreceivables 5,070 5,710
Intercompanyfinancingreceivables(a)(b) 1,968 2,172
Otherreceivables 127 223
Otherassets 711 881
Totalfinancingassets $«31,165 $«34,589
Intercompanypayables(a) $«««5,262 $«««6,531
Debt(c) 20,499 22,320
Otherliabilities 2,348 2,571
Totalfinancingliabilities 28,109 31,422
Totalfinancingequity 3,056 3,167
Totalfinancingliabilitiesandequity $«31,165 $«34,589
(a) AmountseliminatedforpurposesofIBM’sconsolidatedresultsandthereforedo
notappearonpage 49.
(b)Theseassets,alongwithallotherfinancingassetsinthistable,areleveraged
usingGlobalFinancingdebt.
(c) GlobalFinancingdebtincludesdebtofthecompanyandoftheGlobalFinancing
unitsthatsupporttheGlobalFinancingbusiness.