IBM 2005 Annual Report Download - page 26
Download and view the complete annual report
Please find page 26 of the 2005 IBM annual report below. You can navigate through the pages in the report by either clicking on the pages listed below, or by using the keyword search tool below to find specific information within the annual report.-
 1
1 -
2
-
3
-
4
-
5
-
6
-
7
-
8
-
9
-
10
-
11
-
12
-
13
-
14
-
15
-
 16
16 -
 17
17 -
 18
18 -
 19
19 -
 20
20 -
 21
21 -
 22
22 -
 23
23 -
 24
24 -
 25
25 -
 26
26 -
 27
27 -
 28
28 -
 29
29 -
 30
30 -
 31
31 -
 32
32 -
 33
33 -
 34
34 -
 35
35 -
 36
36 -
37
-
38
-
39
-
40
-
41
-
42
-
43
-
44
-
45
-
46
-
47
-
48
-
49
-
50
-
51
-
52
-
53
-
54
-
55
-
56
-
57
-
58
-
59
-
60
-
61
-
62
-
63
-
64
-
65
-
66
-
67
-
68
-
69
-
70
-
71
-
72
-
73
-
74
-
75
-
76
-
77
-
78
-
79
-
80
-
81
-
82
-
83
-
84
-
85
-
86
-
87
-
88
-
89
-
90
-
91
-
92
-
93
-
94
-
95
-
96
-
97
-
98
-
99
-
100
-
101
-
102
-
103
-
104
-
105
 |
 |

ManagementDiscussion
INTERNATIONALBUSINESSMACHINESCORPORATION ANDSUBSIDIARYCOMPANIES
_25
revenuedeclined,MIPS(millionsofinstructionspersecond)vol-
umesincreased7percentin2005versus2004.
PersonalComputingDivisionrevenuedecreasedasaresult
of the company divesting its Personal Computing business
toLenovo.The2005resultshavefourmonthsofrevenueversus
12 months of revenue in 2004. See note C, “Acquisitions/
Divestitures,” onpages 66 to 67 foradditionalinformation.
Softwarerevenue increased in 2005 versus2004 driven by
growthinthecompany’skeybrandedMiddlewareofferings,par-
tiallyoffsetbylowerOperatingSystemsrevenue.TheMiddleware
revenue growth was driven by Tivoli software offerings, the
WebSpherefamilyofproducts andLotussoftwareofferings.
Global Financing revenue declined due to a continued
decline in the income-generating asset base and yields. See
pages 43 through 47 for additional information regarding
GlobalFinancing.
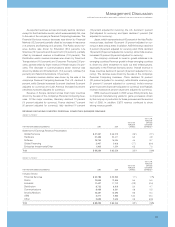
The following table presents each revenue category as a
percentageofthecompany’stotal:
FORTHEYEAR ENDEDDECEMBER31: 2005 2004
GlobalServices 52.0% 48.0%
Hardware 26.7 32.3
Software 17.3 15.7
GlobalFinancing 2.6 2.7
EnterpriseInvestments/Other 1.4 1.3
Total 100.0% 100.0%
margin improvement and permitted the company to improve
pricecompetitivenessinkeymarkets.Inaddition,anincreasein
retirement-relatedplancostsofapproximately$648 million par-
tiallyoffsetbyadecreaseinstock-basedcompensationcostsof
approximately $133 million compared to 2004 also impacted
overallsegmentmargins.See“Segment Details”discussionon
pages 27 to 30 forfurtherdetailsongrossprofit.
Totalexpenseandotherincomedecreased2.4percent(2.9per-
cent adjusted for currency) in 2005 versus 2004. Overall, the
decrease was primarily due to the gain associated with the
divestiture ofthePersonalComputingbusiness ($1,108million),
againfromalegalsettlement withMicrosoft($775million) par-
tiallyoffsetbyincrementalrestructuringcharges ($1,706 million)
recordedinthesecondquarterof2005.Theexpense-to-revenue
ratio increased 0.8 points to 26.7 percent in 2005, as revenue
declined5.4percentandexpensedeclined2.4percentin2005
versus2004.Foradditionalinformationregardingthedecrease
inTotalexpenseand otherincome,seethefollowing analyses
bycategory:
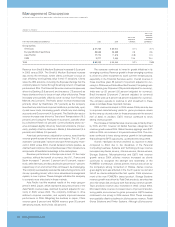
SELLING,GENERALANDADMINISTRATIVE(SG&A)
(Dollarsinmillions)
YR. TOYR.
FORTHEYEARENDEDDECEMBER31: 2005 2004* CHANGE
Selling,generaland
administrativeexpense:
Selling,generaland
administrative—base $«16,845 $«16,690 0.9%
Advertisingand
promotionalexpense 1,284 1,335 (3.8)
Workforcereductions—ongoing 289 397 (27.2)
Restructuring 1,475 —NM
Retirement-relatedexpense 846 610 38.7
Stock-basedcompensation 606 914 (33.7)
Baddebtexpense (31) 133 (123.3)
Total $«21,314 $«20,079 6.1%
* Reclassifiedtoconformwith2005presentation.
NM—NotMeaningful
Total SG&A expense increased 6.1 percent (5.7 percent
adjustedforcurrency).Theincreasewasprimarilydrivenbythe
restructuringchargesrecordedin thesecondquarterof2005.
Seenote R,“2005 Actions” onpages 80 and81 foradditional
information.Inaddition,retirement-relatedexpensesincreased
in2005.Seethe“Retirement-RelatedBenefits” captiononpage
27 foradditionalinformation.Theseincreaseswerepartiallyoff-
setbyloweroperationalexpensesasaresultoftherestructuring
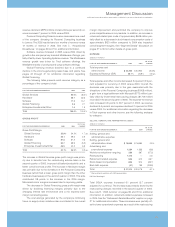
GROSS PROFIT
YR. TOYR.
FORTHEYEARENDEDDECEMBER31: 2005 2004 CHANGE
GrossProfitMargin:
GlobalServices 25.9% 24.2% 1.7 pts.
Hardware 35.1 29.5 5.6
Software 87.5 87.2 0.3
GlobalFinancing 54.7 59.9 (5.2)
EnterpriseInvestments/Other 46.5 40.2 6.3
Total 40.1% 36.9% 3.2 pts.
EXPENSE
(Dollarsinmillions)
YR. TOYR.
FORTHEYEARENDEDDECEMBER31: 2005 2004 CHANGE
Totalexpenseand
otherincome $«24,306 $«24,900 (2.4) %%
ExpensetoRevenue(E/R) 26.7% 25.9% 0.8 pts.
TheincreaseinGlobalServicesgrossprofitmarginwasprima-
rily due to benefits from the restructuring actions taken in the
secondquarterof2005,improvedutilization/productivityanda
betteroverallcontractprofile.TheincreaseinHardwaremargin
wasprimarilyduetothe divestiture ofthePersonalComputing
business(whichhadalowergrossprofitmarginthantheother
hardwarebusinesses)inthesecondquarterof2005.Thissale
contributed 3.8 points to the increase in the 2005 margin.
Microelectronics’ marginsincreasedduetoimprovingyields.
ThedecreaseinGlobalFinancinggrossprofitmarginwas
driven by declining financing margins primarily due to the
changing interest rate environment and a mix towards lower
marginremarketingsales.
The cost savings generated by the company’s continuing
focusonsupply-chaininitiativesalsocontributedtotheoverall