IBM 2005 Annual Report Download - page 39
Download and view the complete annual report
Please find page 39 of the 2005 IBM annual report below. You can navigate through the pages in the report by either clicking on the pages listed below, or by using the keyword search tool below to find specific information within the annual report.-
 1
1 -
2
-
3
-
4
-
5
-
6
-
7
-
8
-
9
-
10
-
11
-
12
-
13
-
14
-
15
-
16
-
17
-
18
-
19
-
20
-
21
-
22
-
23
-
24
-
25
-
26
-
27
-
28
-
 29
29 -
 30
30 -
 31
31 -
 32
32 -
 33
33 -
 34
34 -
 35
35 -
 36
36 -
 37
37 -
 38
38 -
 39
39 -
 40
40 -
 41
41 -
 42
42 -
 43
43 -
 44
44 -
 45
45 -
 46
46 -
 47
47 -
 48
48 -
 49
49 -
50
-
51
-
52
-
53
-
54
-
55
-
56
-
57
-
58
-
59
-
60
-
61
-
62
-
63
-
64
-
65
-
66
-
67
-
68
-
69
-
70
-
71
-
72
-
73
-
74
-
75
-
76
-
77
-
78
-
79
-
80
-
81
-
82
-
83
-
84
-
85
-
86
-
87
-
88
-
89
-
90
-
91
-
92
-
93
-
94
-
95
-
96
-
97
-
98
-
99
-
100
-
101
-
102
-
103
-
104
-
105
 |
 |

ManagementDiscussion
INTERNATIONALBUSINESSMACHINESCORPORATION ANDSUBSIDIARYCOMPANIES
Thecashtaxratediffersfromthe company’seffective tax rate
duetoanumberofvariablesincluding,butnotlimitedto, certain
items of income and expense that are recognized in different
yearsforfinancialreportingpurposesthanforincometaxpur-
poses,differencesin currency ratesusedinthetranslationofthe
non-U.S.income tax provision and incometax payments, and
current-year cash tax payments or refunds that are related to
prioryears. Thecompanyanticipatesthatits cashtaxratewill
approximate the upper end of this range for the near term.
However, once thecompany fullyutilizes its alternativeminimum
taxcredits or losscarryforwards, the possibilityexists that the
cashtaxratecouldincrease.
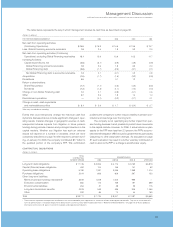
LiquidityandCapitalResources
Thecompanygeneratesstrongcashflowfromoperations,pro-
vidingasourceoffundsrangingbetween$13.7 billionand$15.3
billionperyearoverthepastfiveyears.Thecompanyprovides
for additional liquidity through several sources; a sizable cash
balance,accesstoglobalfundingsources,acommittedglobal
creditfacilityandin2004,thecompanyconvertedareceivables
securitization facility from an “uncommitted” to a “committed”
facility, adding an additional source of liquidity. (See note J,
“SecuritizationofReceivables” onpage 70 foradditionalinforma-
tion). The table below provides a summary of these major
sources of liquidity for the years ended December 31, 2001
through 2005.
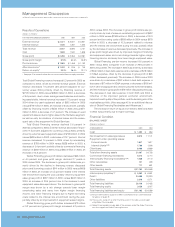
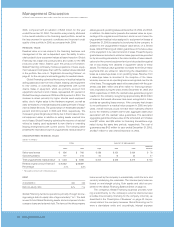
CASH FLOW AND LIQUIDITY TRENDS
(Dollarsinbillions)
2005 2004 2003 2002 2001
Netcashfrom
operating activities $«14.9 $«15.3 $«14.5 $«13.8 $«13.7
Cashandmarketable
securities $«13.7 $«10.6 $«««7.6 $«««6.0 $«««6.4
Sizeofglobal
creditfacilities $«10.0 $«10.0 $«10.0 $«12.0 $«12.0
Tradereceivables
securitizationfacility $«««0.5 $«««0.5 $««««— $««««— $««««—
Themajorratingagencies’ ratingsonthecompany’sdebtsecu-
ritiesatDecember31,2005 appearinthe following table andre-
mainunchangedoverthepastfiveyears.Thecompanyhasno
contractualarrangementsthat,intheeventofachangeincredit
rating,wouldresultinamaterialadverse effectonits financial
positionorliquidity.
STANDARD MOODY’S
AND INVESTORS FITCH
POOR’S SERVICE RATINGS
Seniorlong-termdebt A+ A1 AA-
Commercialpaper A-1 Prime-1 F1+
The company prepares its Consolidated Statement of Cash
Flows in accordance with SFAS No. 95, “Statement of Cash
Flows,” onpage 50 andhighlightscausesandeventsunderly-
ingsourcesandusesofcashinthatformatonpage 31.Forpur-
posesofrunningitsbusiness,thecompanymanages,monitors
andanalyzescashflowsinadifferentformat.
Asdiscussedonpage 43,oneofthecompany’stwoprimary
objectivesofitsGlobalFinancingbusinessistogeneratestrong
return on equity. Increasing receivables is the basis for growth
in a financing business. Accordingly, management considers
GlobalFinancingreceivablesasaprofit-generatinginvestment-
not as working capital that should be minimized for efficiency.
After classifying the Global Financing accounts receivables as
aninvestment,theremainingnetcashflowisviewedbythecom-
panyastheCashavailableforinvestmentandfordistributionto
shareholders.Withrespecttothecompany’scashflowanalysis
for internal management purposes (see the first table on page
39),Global Financing accountsreceivablesarecombined with
Global Financing debt to represent the Net Global Financing
debttoaccountsreceivable (aprofit-generatinginvestment).
From the perspective of how management views cash
flows, in 2005, net cash from operating activities, excluding
GlobalFinancing receivables, was$13.1 billion, an increaseof
$0.2 billion compared to 2004. This cash performance was
driven primarily by the growth in net income from continuing
operationsandthecompany’scontinuedfocusonworkingcap-
italandsupply-chainmanagement.Thecompanyreturnedover
100percentofnetincomein2005toshareholdersindividend
paymentsandsharerepurchases.
Overthepastfiveyears,thecompanygeneratedover$60.8
billion in Cash available for investment and for distribution to
shareholders. As a result, during the period the company
invested $20.6 billionofnetcapitalexpenditures,invested$9.1
billioninstrategicacquisitions,received$2.2 billionfromdivesti-
tures and returned $34.1 billion to shareholders through divi-
dends and share repurchases. The amount of prospective
Returns to shareholders in the form of dividends and share
repurchases will vary based upon several factors including
affordability, namely each year’s operating results, capital
expenditures,researchanddevelopment,andacquisitions,as
well as the factors discussed immediately following the first
table onpage39.
The company’s Board of Directors meets quarterly to
consider thedividendpayment. Thecompanyexpectstofund
dividendpaymentsthroughcashfromoperations.
38_ ManagementDiscussion