IBM 2005 Annual Report Download - page 94
Download and view the complete annual report
Please find page 94 of the 2005 IBM annual report below. You can navigate through the pages in the report by either clicking on the pages listed below, or by using the keyword search tool below to find specific information within the annual report.
NotestoConsolidatedFinancialStatements
INTERNATIONALBUSINESSMACHINESCORPORATION ANDSUBSIDIARYCOMPANIES
_93
FUNDED STATUS
DEFINEDBENEFITPENSIONPLANS
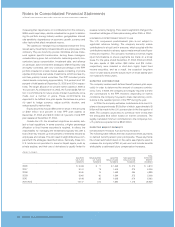
It is the company’s general practice to fund amounts for pen-
sions sufficient to meet the minimum requirements set forth in
applicableemployeebenefitslawsandlocaltaxlaws. Fromtime
to time, the company contributes additional amounts as it
deemsappropriate.
DuringtheyearsendedDecember31,2005and2004,the
company contributed $1,715 million and $700 million in cash,
respectively, to thequalifiedportionofthePPP.Therewerecon-
tributionsof$561 millionand$1,085milliontothematerialnon-
U.S. plans during the years ended December 31, 2005 and
2004,respectively.
Thecompanydecidednottofundcertainofthecompany’s
non-U.S. plans that had unfunded positions to the ABO level
whichrequiredthecompanytorecorda minimumpensionliabil-
ity.AsofDecember31,2005,thecompanyrecordedareduction
to the minimum liability of $1,726 million and an increase to
stockholders’ equity of $436 million. In 2004, the company
recorded an increase to the minimum liability of $1,827 million
anda reduction tostockholders’ equityof$1,008million.Thedif-
ferences between these amounts and the amounts included
in the Consolidated Statement of Financial Position and
Consolidated Statement of Stockholders’ Equity relate to the
non-materialplans.Thisaccountingtransactiondidnotimpact
2005and2004retirementrelatedplanscost.
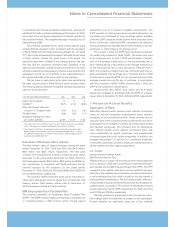
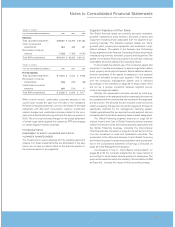
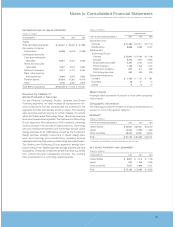
Thefollowingtablepresentsthefundedstatusofthecom-
pany’sdefinedbenefitpensionplans.
(Dollarsinmillions)
2005 2004
BENEFIT PLAN BENEFIT PLAN
OBLIGATION ASSETS OBLIGATION* ASSETS
PlanswithPBOinexcessofplanassets $«26,354 $«17,241 $«31,256 $«19,921
PlanswithABOinexcessofplanassets $«24,986 $«17,241 $«24,945 $«15,428
PlanswithassetsinexcessofPBO $«58,073 $«62,810 $«53,418 $«56,024
* Prioryearamountshavebeenreclassifiedtoconformwithcurrentyearpresentation.
NONPENSIONPOSTRETIREMENT BENEFIT PLANS
The U.S. nonpension postretirement plan is not subject to
significant advance funding. The company currently makes
contributions toatrustfundinamounts,which, coupledwiththe
contributions made by retirees, approximate annual benefit
paymentsandexpenses.
PLAN ASSETS
DEFINEDBENEFITPENSIONPLANS
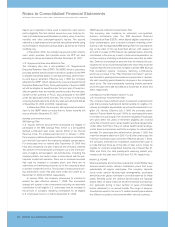
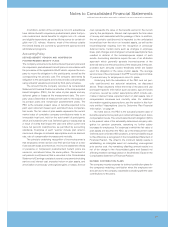
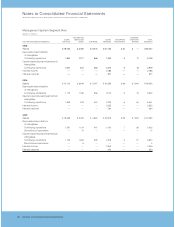
Thecompany’spensionplans’ weighted-averageassetalloca-
tionsatDecember31,2005and2004andtargetallocationfor
2006,byassetcategory,areasfollows:
U.S.Plans
PLANASSETS
ATDECEMBER31:
2005 2004
AssetCategory:
Equitysecurities* 63.8% ««««««65.4% ««««««63%
Debtsecurities 32.9 31.6 33
Realestate 3.3 3.0 4
Total 100.0% 100.0% 100%
* Seethefollowingdiscussionregardingcertainprivatemarketassets,andfuture
fundingcommitmentsthereof,thatarenotasliquidastherestofthepublicly
tradedsecurities.
MaterialNon-U.S.Plans
PLANASSETS
ATDECEMBER31:
2005 2004
AssetCategory:
Equitysecurities 61.6% ««««««58.4% ««««««61%
Debtsecurities 36.3 38.8 37
Realestate 1.8 2.0 2
Other 0.3 0.8 —
Total 100.0% 100.0% 100%
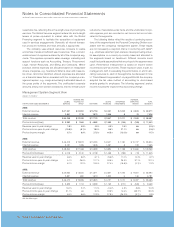
The investment objectives of the PPP portfolio of assets (the
Fund)aredesignedtogeneratereturnsthatwillenabletheFund
tomeetitsfutureobligations.Thepreciseamountforwhichthese
obligations will be settled depends on future events, including
the life expectancy of the Plan’s members and salary inflation.
The obligations are estimated using actuarial assumptions,
basedonthecurrenteconomicenvironment. TheFund’sinvest-
ment strategy balances the requirement to generate returns,
usingpotentiallyhigheryieldingassetssuchasequitysecurities,
withtheneedtocontrolriskintheFundwithlessvolatileassets,
such as fixed-income securities. Risks include, among others,
inflation,volatilityinequityvaluesandchangesin interestrates
that could cause the Plans to become underfunded, thereby
2006
TARGET
ALLOCATION
2006
TARGET
ALLOCATION


